Mini Lesson/Activity
Correlating Shortwave Radiation and Cloud Coverage
Overview
Students differentiate between data sets of monthly shortwave radiation and monthly cloud coverage to discover a relationship between radiation and clouds by answering analysis questions.
Student Directions
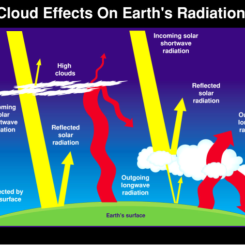
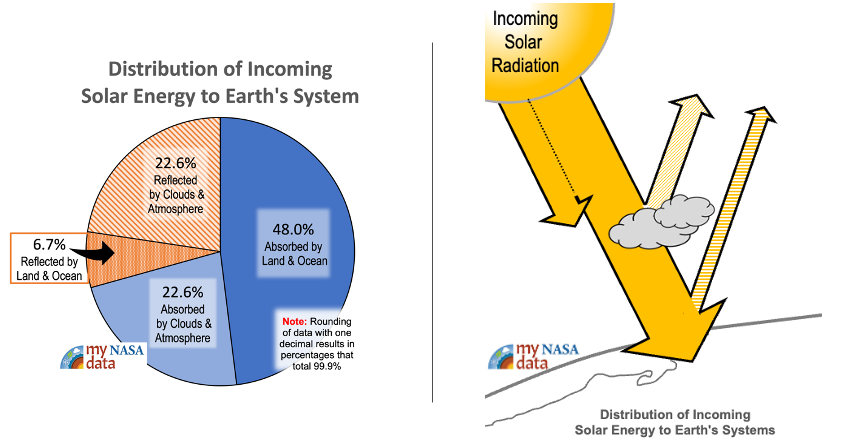
The Earth’s Energy Budget is considered balanced when the incoming energy from the Sun and the outgoing energy from Earth are equal. The Sun releases energy in the form of shortwave radiation and ultraviolet light. When this energy reaches Earth, some of that energy is reflected back to space by clouds and the atmosphere, while some of that energy is absorbed by the Earth’s surface.
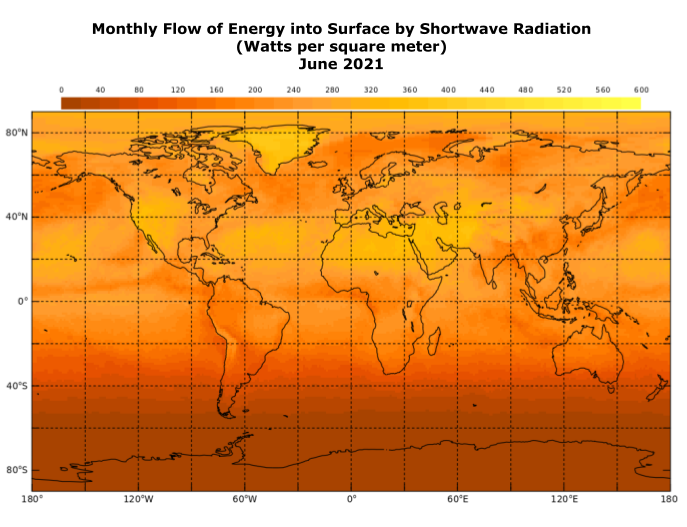
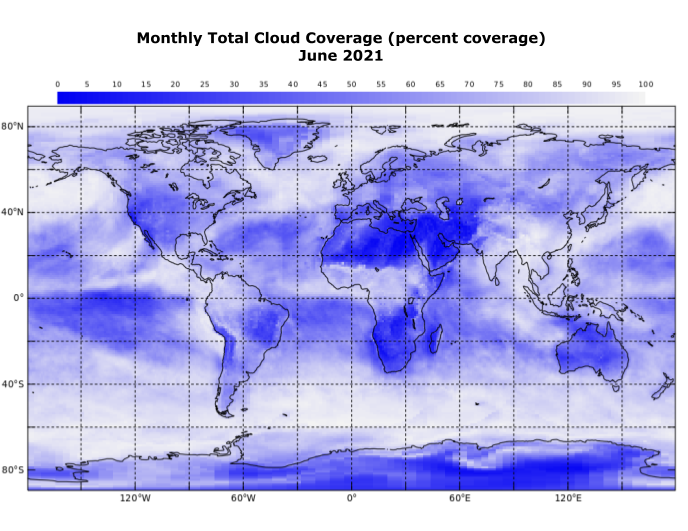
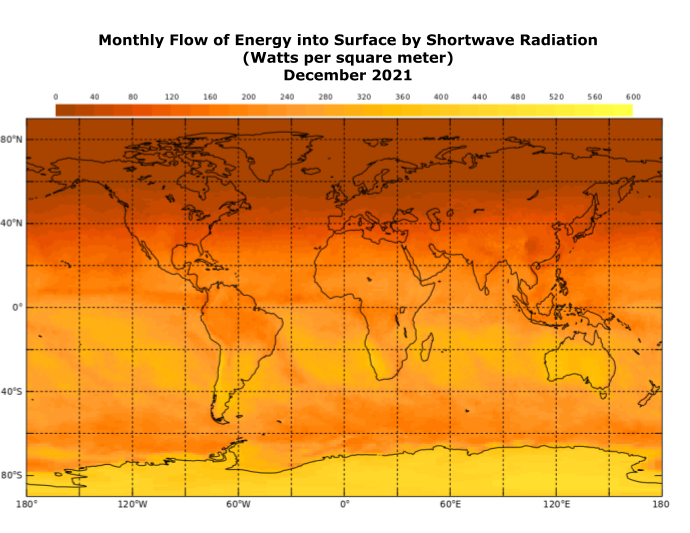
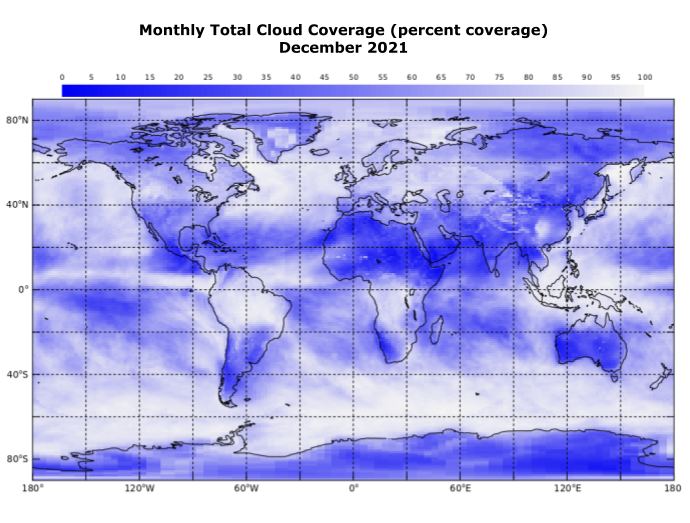
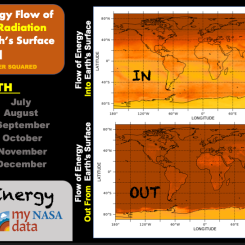
Observe the amount of shortwave radiation coming to Earth’s surface and how it relates to cloud coverage in the atmosphere. Review the Monthly Flow of Energy Into Surface by Shortwave Radiation from June and December of 2021. Compare that dataset to Monthly Cloud Coverage from June and December of 2021. Next, answer the following questions below.
Steps:
- Check with your instructor on how to submit your answers.
- Describe one thing about the datasets that catches your attention.
- Looking at the datasets entitled Monthly Flow of Energy into Surface by Shortwave Radiation, identify the areas on the maps that have absorbed the least amount of the Sun’s shortwave radiation.
- June 2021:
- December 2021:
- Keeping with the same datasets, identify the areas on the maps that have absorbed the most shortwave radiation.
- June 2021:
- December 2021:
- Switching over to the datasets Monthly Cloud Coverage, identify the areas on the maps that have the highest percentages of cloud coverage.
- June 2021:
- December 2021:
- Identify the areas on the Monthly Cloud Coverage maps that have the lowest percentages of cloud coverage.
- June 2021:
- December 2021:
- List the evidence that you found to explain the relationship between shortwave radiation and clouds.
- Can you pinpoint any other factor(s) that affect the amount of shortwave radiation reaching Earth’s surface besides clouds? Explain.
Sources:
- LAS UI. (n.d.). My NASA Data. Retrieved August 24, 2022, from https://mynasadata.larc.nasa.gov/EarthSystemLAS/UI.vm
Teacher Note
Teachers, these mini lessons/student activities are perfect "warm up" tasks that can be used as a hook, bell ringer, exit slip, etc. They take less than a class period to complete. Learn more on the "My NASA Data What are Mini Lessons?" page.
Teachers who are interested in receiving the answer key, please complete the Teacher Key Request and Verification Form. We verify that requestors are teachers prior to sending access to the answer keys as we’ve had many students try to pass as teachers to gain access.
Disciplinary Core Ideas:
- PS4B: Electromagnetic Radiation
- ESS2A: Earth Materials and Systems
Crosscutting Concepts:
- Structure and Function
- Stability and Change
Science and Engineering Practices:
- Developing and Using Models
Complementary Mini Lessons
Complementary Interactives


Interactive Files
Grade Band
- 6-8
Time
- 30 minutes
Visualization Tool
NGSS Three Dimensional Learning
- See drop-down menu at the bottom of the page