Lesson Plans
Ins and Outs of Shortwave Radiation
Overview
Students construct explanations about Earth’s energy budget by connecting a model with observations from side-by-side animations of the monthly mapped data showing incoming and outgoing shortwave radiation from Earth’s surface.
Materials Required
- The Ins and Outs of Shortwave Radiation (optional)
Procedure
This activity has specifically designed question sets about different aspects of the model presented. Instruct your students which question set(s) they will be addressing in a particular classroom session. It may be helpful to use this as a classroom starter over multiple days with each question set being addressed on a different day. Returning to evaluate data over multiple days will reinforce student data analysis skills and spatial reasoning and provide greater opportunity for students to find success with interpreting the data.
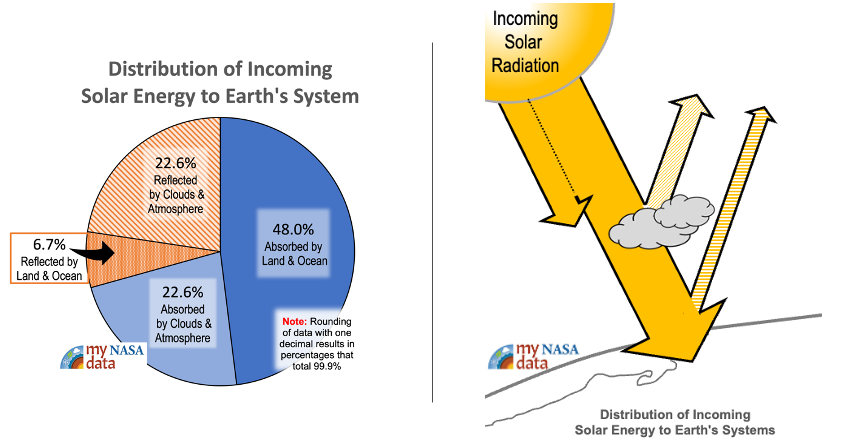
This activity may be used to help students check their understanding of a commonly used model of Earth’s energy budget. The model has been edited to focus on one aspect, the distribution of incoming solar radiation. Students discover that models communicate key information that assist with making explanation about processes but do so by making assumptions or approximations that often don’t provide a snapshot of specific conditions.
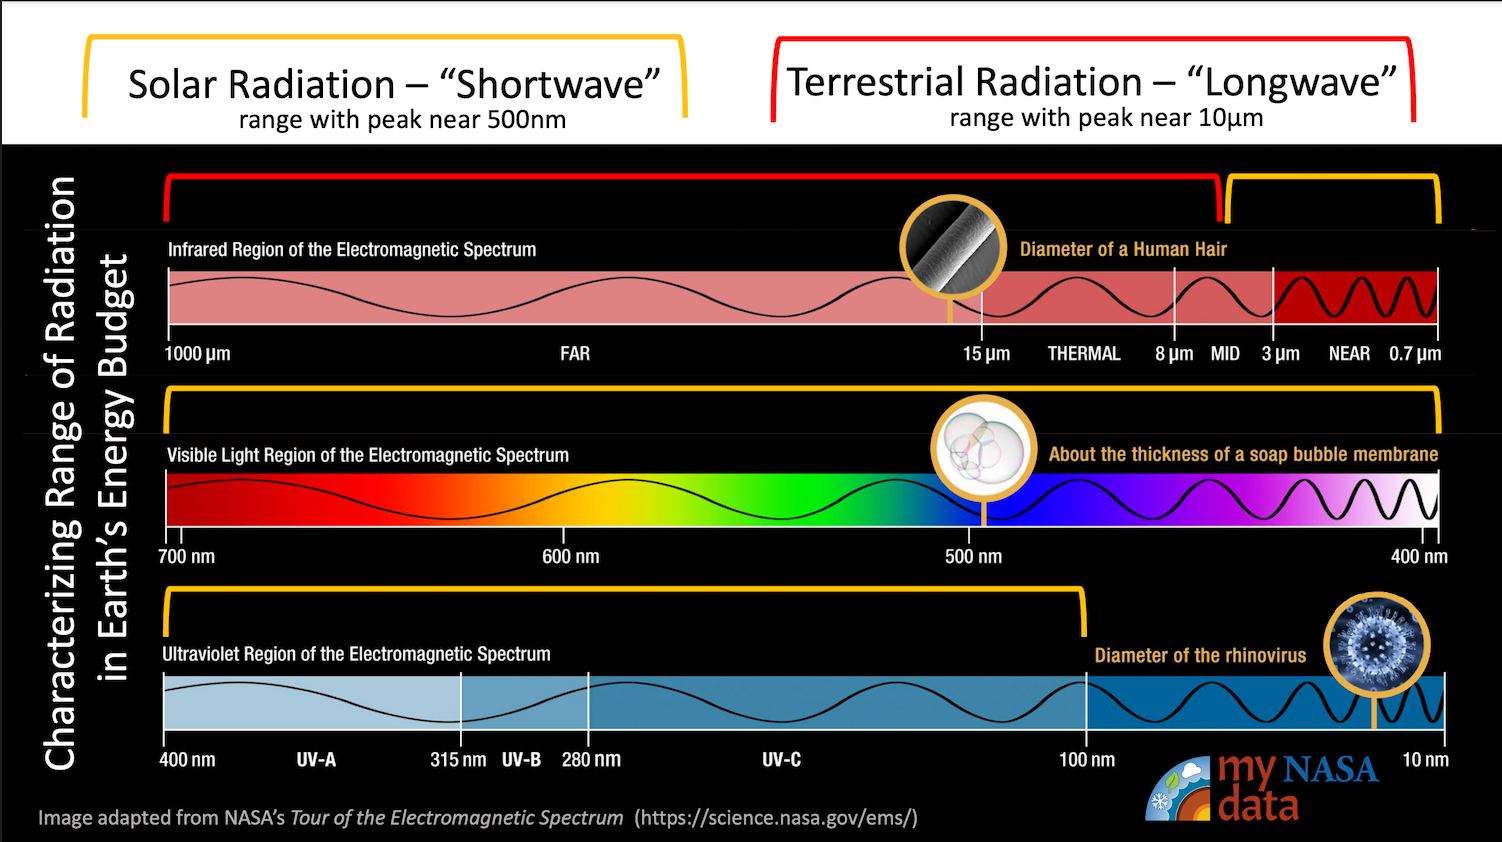
Prior to this lesson, students should have familiarity with the electromagnetic spectrum as well as an introduction to the initial fate of incoming solar radiation in terms of interactions with specific systems (See lesson Modeling Incoming Solar Radiation).
If this lesson serves as an introduction to the energy model, the teacher should spend time familiarizing students with the various components of the model in terms aspects of the infographics that are used to communicate the process of energy transfer in Earth systems.
This activity is not suggested as a summative assessment.
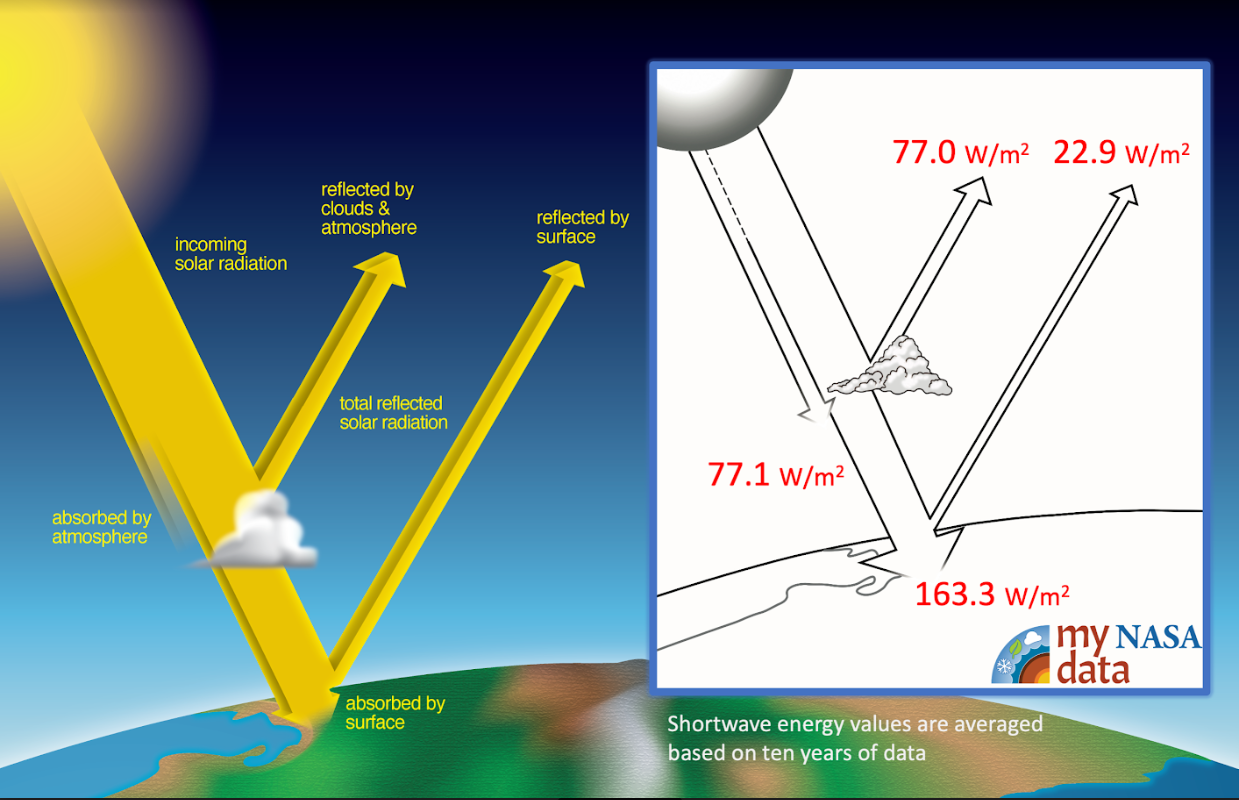
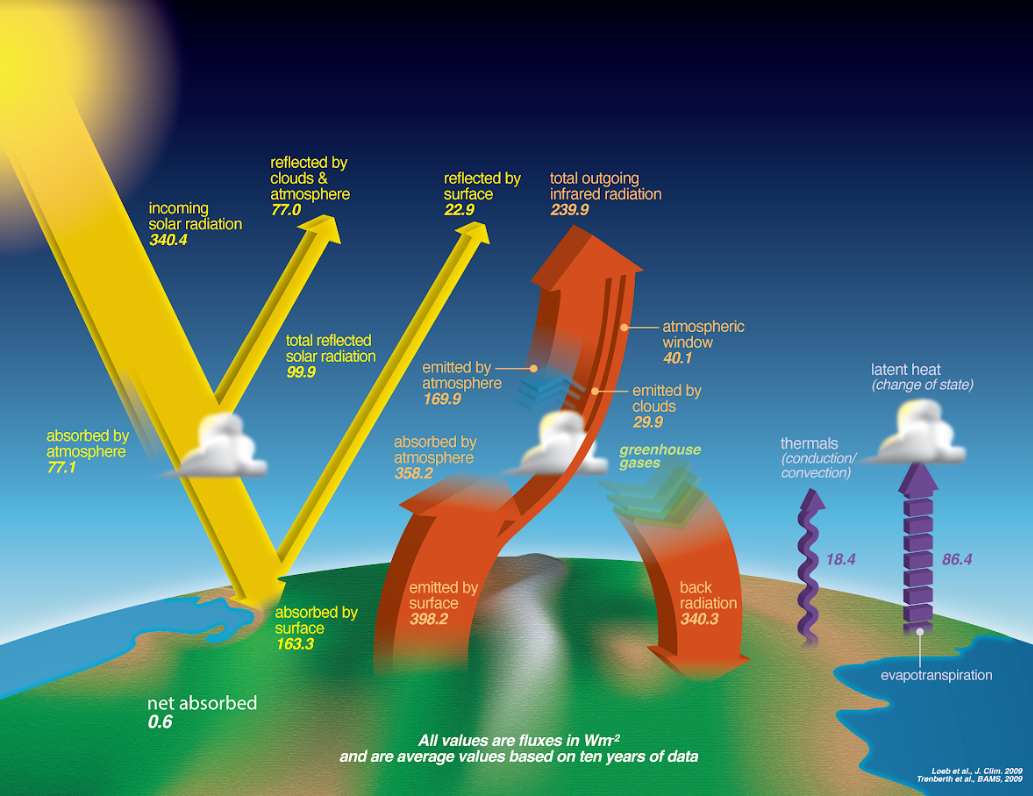
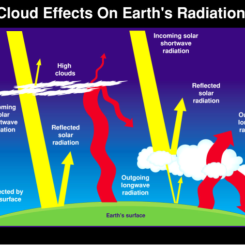
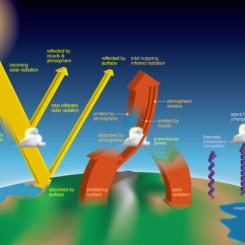
The model below describes what first happens to the incoming shortwave radiation that is received from the sun after it reaches the top of the Earth’s atmosphere. Incoming ultraviolet, visible, and a limited portion of infrared energy (together sometimes called "shortwave radiation") from the Sun drive the Earth's climate system. This radiation is measured as energy flow (radiant flux) per unit area and has a unit of Watts per meter squared (W/m2).
To understand how and why our climate system is changing, the story starts with the Sun’s energy as it enters the top of the Earth’s atmosphere and is either reflected or absorbed. When the energy is reflected, some of the radiant energy is simply returned in the same form it arrived. Therefore, it possesses the same energy. The wave properties such as wavelength and frequency are preserved.
Question Set #1: Relating Shortwave Energy Flow Data to a Phenomena. A student standing at the North Pole would observe the phenomena of complete darkness during the winter months. Measured average temperatures of -40oC have been recorded when there is 0 W/m2 recorded.
- Use the model to explain the absence of incoming solar radiation during the winter months.
- Use the model to explain what attributes of the Earth system results in relatively warm surface temperatures in the absence of direct incoming solar radiation. (Nighttime temperatures on the moon’s equator average -140oC).
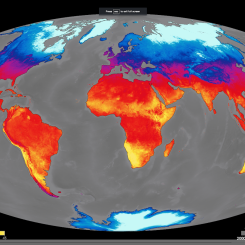
Below is an animation of the 2019 monthly observations of shortwave energy flow going into and reflecting from land and ocean surfaces. These data are obtained from the NASA CERES (The Clouds and the Earth’s Radiant Energy System) project. This mission provides satellite-based observations of Earth’s Radiation Budget in order to better understand the global climate data record.
Consider how the model helps us understand the CERES data and the complexity of Earth’s energy budget.
Examine the monthly animation below and answer the following questions to explore how a model can support your thinking that links the scientific data with your understanding about the fate of short wave solar radiation that enters the Earth system. Use the model and animation below to help you answer the questions assigned by the following questions.

Question Set #2: Monthly Shortwave Energy Flow Into Earth’s Surface
- Identify the months with the greatest amount of energy flow into the Earth’s surface in the northern hemisphere? (southern hemisphere?)
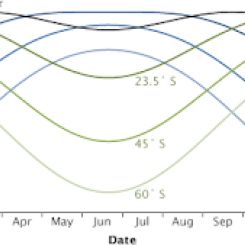
- Describe and explain the pattern of general monthly trends in the data for the amount of incoming radiation at different latitudes.
- Analyze the data and identify a specific region using latitude and longitude that does not follow the general monthly trends you identified above.
- Use the model to explain why locations may not follow general monthly changes in energy flow out from the Earth’s surface that follow latitudinal lines.
- If you needed additional evidence other than radiation data to support your argument, explain what type of data you would request.
Question Set #3: Monthly Shortwave Energy Flow Out From Earth’s Surface
- Identify the months with the greatest amount of energy flowing out from the Earth’s surface in the northern hemisphere? (southern hemisphere?)
- Describe and explain the pattern observed between the monthly trends of energy flow out from the Earth’s surface and the monthly trends of changes in the amount of incoming radiation at different latitudes.
- Analyze the data and identify a specific region using latitude and longitude that does not follow the general monthly trends you identified above.
- Use the model to explain why locations may not follow general monthly changes in energy flow out from the Earth’s surface that follow latitudinal lines.
- If you needed additional evidence other than radiation data to support your argument, explain what type of data you would request.
Question Set #4: Evaluating Earth’s Energy Budget Mode. The Earth’s Energy Budget model is used to communicate information about the complex movement of energy in the Earth system. As all models, it has strengths and limitations. After investigating some CERES data, let’s evaluate the model’s ability to communicate interactions of shortwave radiation within the Earth system.
- Identify one strength of the model that allows you to effectively communicate the evidence gathered by the CERES data.
- Identify one limitation of the model that is revealed by the evidence presented by the CERES data.
Answers:
Teachers who are interested in receiving the answer key, please complete the Teacher Key Request and Verification Form. We verify that requestors are teachers prior to sending access to the answer keys as we’ve had many students try to pass as teachers to gain access.
Sources:
- (2022, April 8). Clouds and the Earth's Radiant Energy System: CERES. Retrieved [August 10, 2022], from https://ceres.larc.nasa.gov/
- National Aeronautics and Space Administration, Science Mission Directorate. (2010). The Earth's Radiation Budget. Retrieved [August 10, 2022], from NASA Science website: http://science.nasa.gov/ems/13_radiationbudget
- Which pole is colder? (2022, May 31). NASA Climate Kids. Retrieved [August 10, 2022], from https://climatekids.nasa.gov/polar-temperatures/
Disciplinary Core Ideas:
- ESS2A: Earth Materials and Systems
Crosscutting Concepts:
- Patterns
- Cause and Effect
- Systems and System Models
Science and Engineering Practices:
- Developing and Using Models
- Analyzing and Interpreting Data
- Constructing Explanations and Designing Solutions
- Engaging in Argument from Evidence
- Obtaining, Evaluating and Communicating Information
What is the Earth's Energy Budget?
- Internet Required
Complementary Lesson Plans

Complementary Mini Lessons
Complementary Interactives

Grade Band
- 6-8
- 9-12
Time
- 50 minutes
Visualization Tool
NGSS Three Dimensional Learning
- See drop-down menu at the bottom of the page