Lesson Plans
Modeling Incoming Solar Radiation
Overview
A kinesthetic activity that challenges students to participate in a model that describes the fate of solar energy as it enters the Earth system. A good initial lesson for Earth’s energy budget, students unravel the benefits and limitations of their model.
Materials Required
Per Student:
- Face to Face: Modeling Incoming Solar Radiation Student Sheets
- A way to sketch and record responses
For Teacher
Procedure
Each student participates to collectively develop a classroom model that assesses the relative distribution of incoming solar radiation once it enters the Earth system. Models are used to help understand and visualize a process. Each student plays the role of incoming solar radiation to the Earth system. The assumptions and limitations of the model are discussed. A Google Slides presentation may be used to facilitate this activity.
- Students work together as a class. Each student represents a unit of energy that just arrived to Earth from the Sun. As a class, students predict how units (students) should represent the amount of solar energy that is reflected as opposed to being absorbed by Earth’s system. Students should gather on one side of the classroom or the other depending on whether they will individually represent solar energy that is absorbed or solar energy that is reflected.
- Optional: Classroom teacher will share information about how the NASA CERES Mission contributes to the scientific understanding about Earth’s Energy budget.
-
Classroom teacher reveals a pie-chart with NASA values from the CERES Mission.
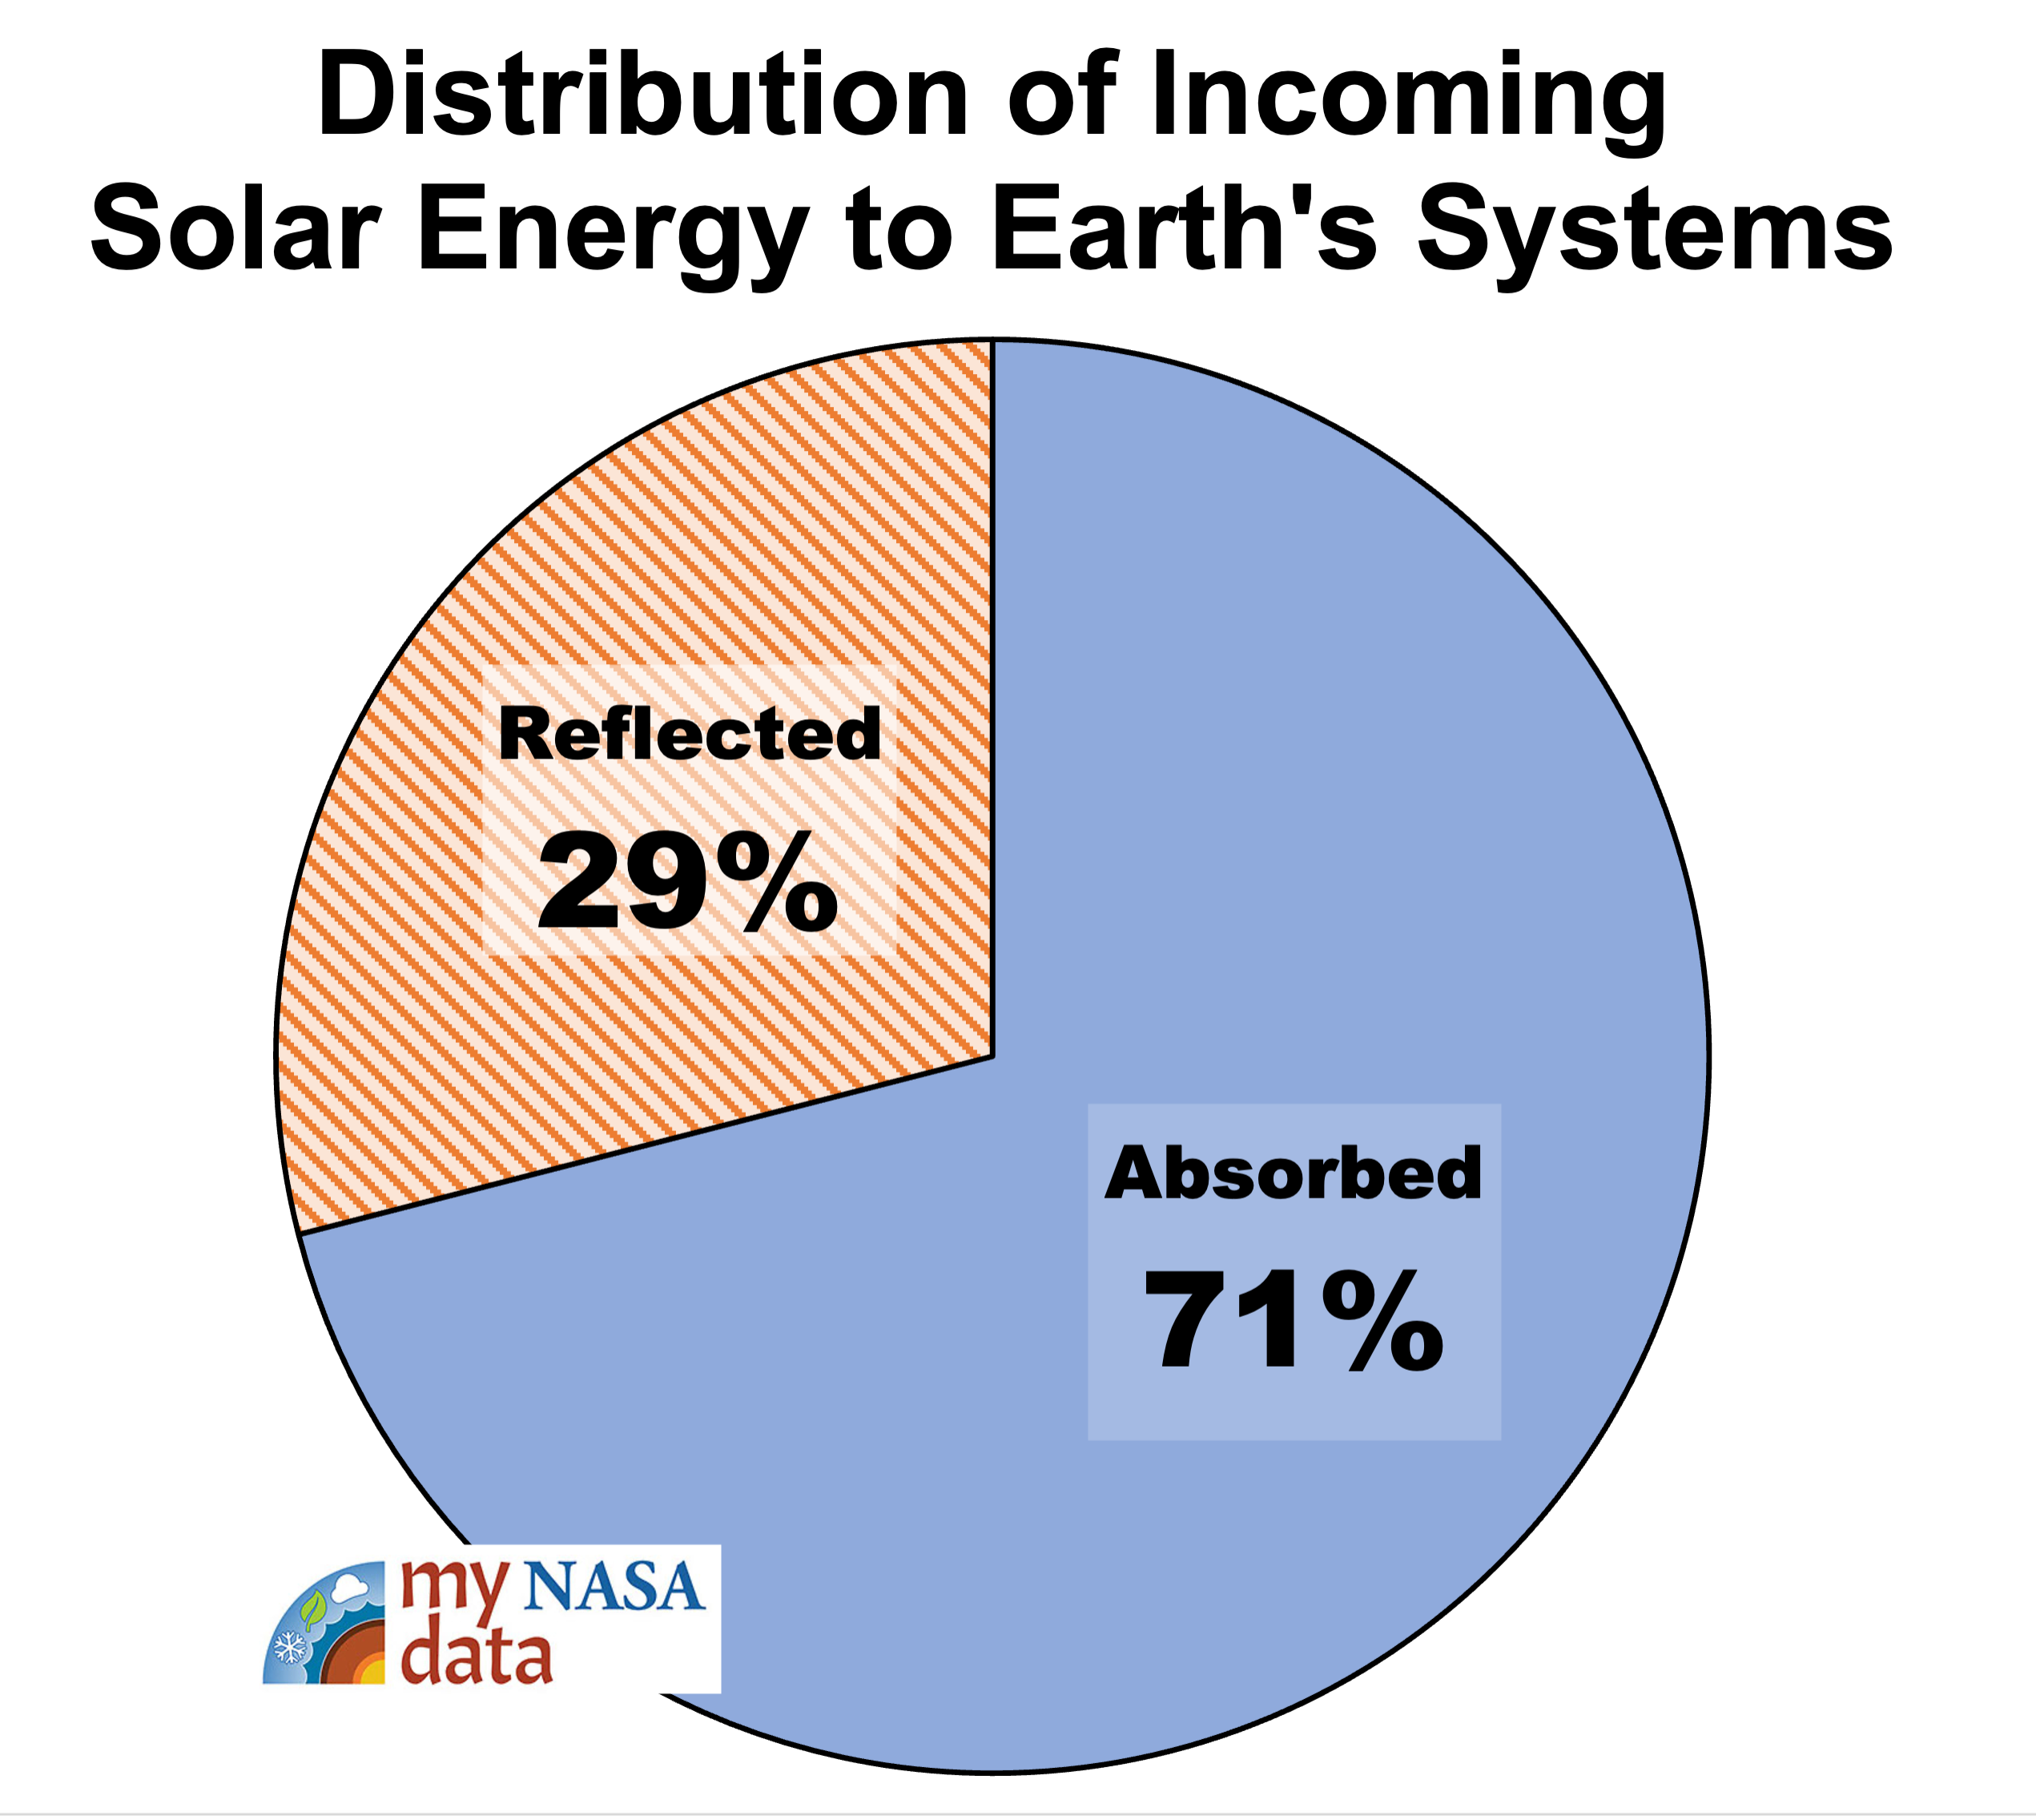
Distribution of Incoming Solar Energy to Earth's Systems
https://mynasadata.larc.nasa.gov/sites/default/files/inline-images/Abs_Refl_EEBIncoming.png
- Working as a group/class, students should revise their values and move as necessary to reflect the NASA values.
- Depending on the numbers in your class, students may find that their human model is difficult to use as the percentages of people in the room may or may not evenly divide into the percentages indicated on the pie chart. Allow students to make a decision on how they will accommodate the difference.
- Optional: Teacher leads a class discussion about the limitations of using a pie chart in terms of relaying accurate values.
-
Each group (as designated by the class model for representing absorbed or reflected energy) should discuss how personal experiences can allow them to further divide into categories to predict the quantities of the solar energy that is absorbed or reflected as a result of a specific part of the Earth system. (Note that the sun’s energy is NOT equally divided)
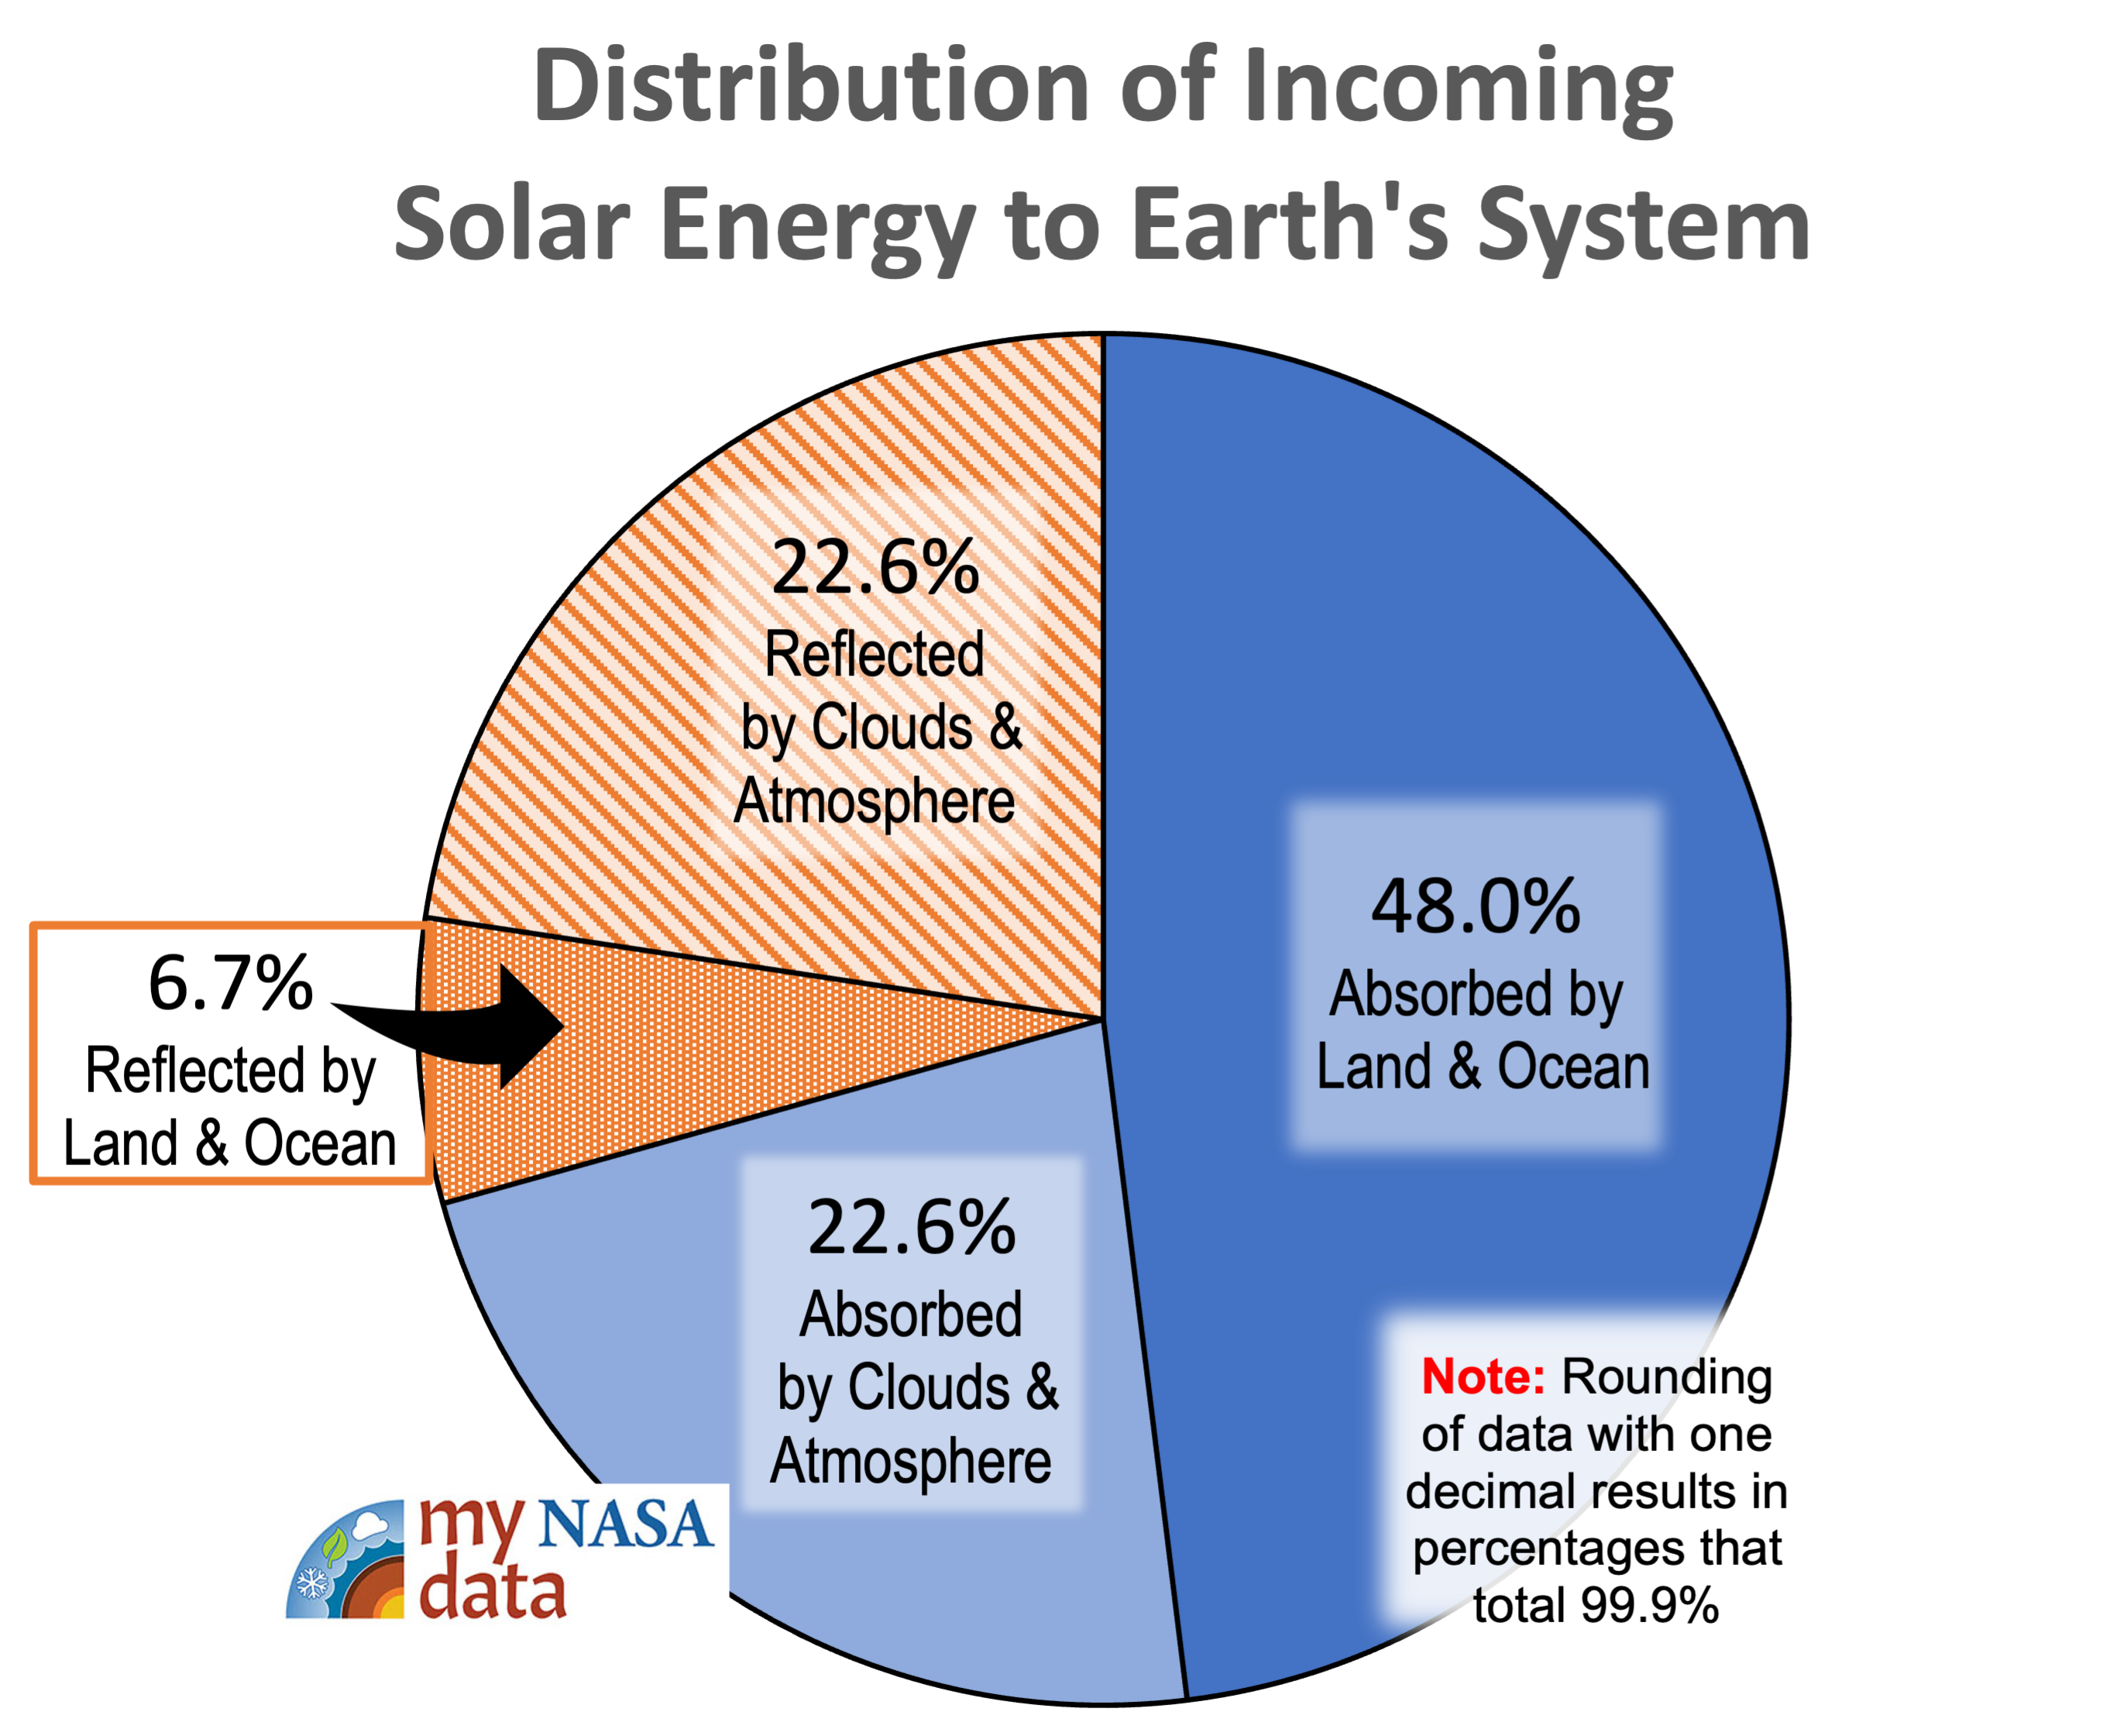
Distribution of Incoming Solar Energy to Earth's Systems category breakdown
https://mynasadata.larc.nasa.gov/sites/default/files/inline-images/All_EEBIncoming.png
- Absorbed or reflected by/from Earth’s surface (land & ocean)
- Absorbed or reflected by/from the atmosphere & clouds
- Classroom teacher will share a more detailed pie-chart with NASA values from the CERES Mission.
- Teacher should facilitate a class discussion to uncover any misconceptions students had that may have been revealed with their predicted values.
- Working as a group/class, students should revise their values and physically move as necessary to reflect the NASA values. Students, once again should accommodate for deciding how their values would reflect the percentages provided.
- Student groups discuss the limitations and strengths of the two models. The teacher then facilitates a class discussion to compare/contrast the two different models, noting the following:
- Limitation: (pie chart and classroom model) Rounding of decimalized values presented as scientific data often present as inaccuracy in the context of a model.
- Limitation: (classroom model) When extrapolating percentages to numbers less than 100, the modelers decisions about rounding result in inaccurate presentation of data.
- Strength: (pie chart and classroom model) Easy to quickly extract qualitative and/or semi-quantitative information in terms of more/less.
- Strength: (classroom model) More likely to remember specific information because you associate with with something external (in this case your peers).
- Working in pairs or small groups, students a asked to consider a third option for a model, an arrow model. Student groups work together to propose how arrows can be used to communicate the relative distribution of incoming solar radiation once it enters the Earth system.
-
Provide students something to sketch with or handout of the arrow model starter diagram or the Modeling Incoming Solar Radiation Student Sheets.
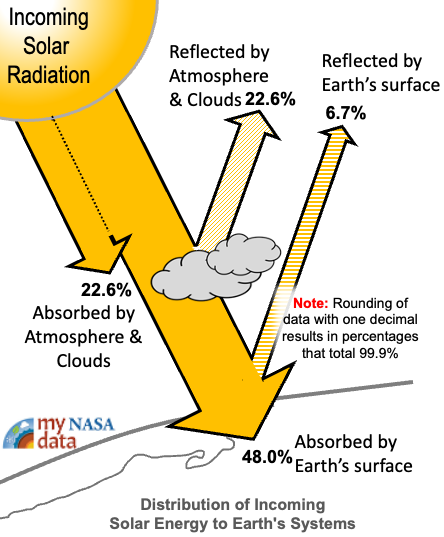
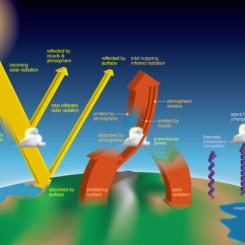
Sample Completed Diagram for Incoming Solar Energy
https://mynasadata.larc.nasa.gov/sites/default/files/inline-images/EEB_cartoon_filled_Pres.png
-
- Teacher reveals the arrow model (either as slide presentation or handouts) used to represent the distribution of incoming solar radiation in the NASA Earth’s Energy Budget diagram.
- Student groups discuss the following :
- Explain how the arrow model changes the communication about the distribution of incoming solar energy?
- Explain how the arrow model worsen or complicates communication about the distribution of incoming solar energy?
- Students share their opinion and evaluate the models.
- Individually, using a 1-4 star ranking, students rank the models for their usefulness as a communication tool. (Page 2 of Student Handout).
- Students can be quickly polled to share their ranking with class.
- Optional: Teacher follows rankings with a a discussion that may serve as a check for understanding.
- Students individually or in pairs complete a learning check to evaluate their ability to identify specific aspects of a model that helps when evaluating them.
- Describe a specific assumption that limits the model’s use.
- Describe an approximation that limit the model’s use.
- Describe an attribute that strengthens the model’s use for a public audience.
- Describe an attribute that strengthens the model’s use for a classroom audience.


Disciplinary Core Ideas:
- ESS2A: Earth Materials and Systems
Crosscutting Concepts:
- Scale, Proportion, and Quantity
- Systems and System Models
Science and Engineering Practices:
- Developing and Using Models
- Students will develop a model that accounts for the relative distribution of incoming solar radiation into Earth’s system.
- Students will compare and contrast three different models to evaluate assumptions and approximations.
- Students will identify the strengths and limitations associated with a specific model used to communicate information about the relative distribution of incoming solar radiation into Earth’s system.
- How does the sun interact with Earth systems?
- How does change in an Earth system impact the fate of incoming solar radiation?
Earth’s heat engine does more than simply move heat from one part of the surface to another; it also moves heat from the Earth’s surface and lower atmosphere back to space. This flow of incoming and outgoing energy is Earth’s energy budget. For Earth’s temperature to be stable over long periods of time, incoming energy and outgoing energy must be equal. In other words, the energy budget at the top of the atmosphere must balance. This state of balance is called radiative equilibrium.
This lesson reveals to students that the story of Earth’s energy budget is more complicated than simply evaluating the amount of sun’s energy that is reflected and absorbed. In future lessons, students will describe the fate of the absorbed radiation and evaluate it’s role in quantifying radiative equilibrium.
Note: Determining exact values for energy flows in the Earth system is an area of ongoing climate research. Different estimates exist, and all estimates have some uncertainty. Estimates come from satellite observations, ground-based observations, and numerical weather models. The numbers in this article rely most heavily on direct satellite observations of reflected sunlight and thermal infrared energy radiated by the atmosphere and the surface.
Students begin to consider how models can be used to represent a complex process such as Earth’s energy budget and the begin to understand both the advantages and disadvantages to using these types of models.
Source: Lindsey, R. (2009, January 14). Climate and Earth's Energy Budget. NASA Earth Observatory. Retrieved July 21, 2022, from https://earthobservatory.nasa.gov/features/EnergyBalance
- Familiarity that the Sun's energy heats land, water, and air of the Earth
- Knowledge of calculating percentage
- Familiarity with pie charts
- Climate is solely attributed to the quantity of incoming solar radiation.
- Seasonal and regional differences in climate result from changes in the Earth’s distance to the sun at certain times of the year.
- Data presented in a pie chart model is 100% accurate.
Scientists monitor the Earth System to better understand and meet the challenges of environmental change. For example, knowing how much of the Sun's energy reaches the surface of the Earth helps scientists understand dynamics in the spheres within the Earth System, i.e., Atmosphere, Hydrosphere, Cryosphere, and Biosphere. An important variable in understanding these changes is Net Radiation because it impacts temperatures. The warm air rising off Earth's landscapes influences our world's weather and climate patterns. NASA leads a wide range of efforts, including CERES, to collect and interpret these data acquired from satellites, aircraft, and ground networks, and to integrate these data into numerical models of the Earth’s climate at global and regional scales.
CERES products include both solar-reflected and Earth-emitted radiation from the top of the atmosphere to the Earth's surface, from which the net radiation can be calculated. Cloud properties are determined using simultaneous measurements by other EOS and NPP instruments such as the Moderate Resolution Imaging Spectroradiometer (MODIS) and the Visible Infrared Imaging Radiometer Suite (VIIRS). Analyses using CERES data build upon the foundation laid by previous missions such as the NASA Earth Radiation Budget Experiment (ERBE), leading to a better understanding of the role of clouds and the energy cycle in global climate change.
For more information on CERES see http://ceres.larc.nasa.gov.
Apply the concept of radiative equilibrium to this model. Earth’s energy budget requires the “Energy In” to Earth’s systems equal “Energy Out”. This model does not account for the energy that is emitted directly from Earth’s spheres. Students can calculate the percent of energy that must leave Earth’s systems in order for radiative equilibrium to be achieved. Student may brainstorm what form that energy takes. (Radiation, Conduction and Convection)
- Teacher computer/projector only
Complementary Lesson Plans

Complementary Mini Lessons
Complementary Interactives
Interactive Files
Grade Band
- 6-8
- 9-12
Time
- 50 minutes
Visualization Tool
NGSS Three Dimensional Learning
- See drop-down menu at the bottom of the page