5E Earth System StoryMap Collection: Lesson Plans
|
|

|
||
|

|

|
||
|

|

|
||

|

|
Are you looking for interactive lesson plans using visualizations and authentic data to address important processes and phenomena in the Earth System?
Check out these StoryMaps. The My NASA Data StoryMaps are an immersive means of storytelling that combine rich narrative text with interactive maps and NASA data, along with other multimedia content like images and videos. They are written using the 5E Model, and they address the Earth System phenomena that you teach.
See full descriptions below the table:
|
|
|
|
|
|
Visit our StoryMaps by clicking the links below:
 In the Air Quality StoryMap, students analyze air quality index, pollutant concentration, and Nonattainment Area data to describe air quality trends over time. In the final section, students will use air quality data to make a prediction about the source of air pollution in a location.
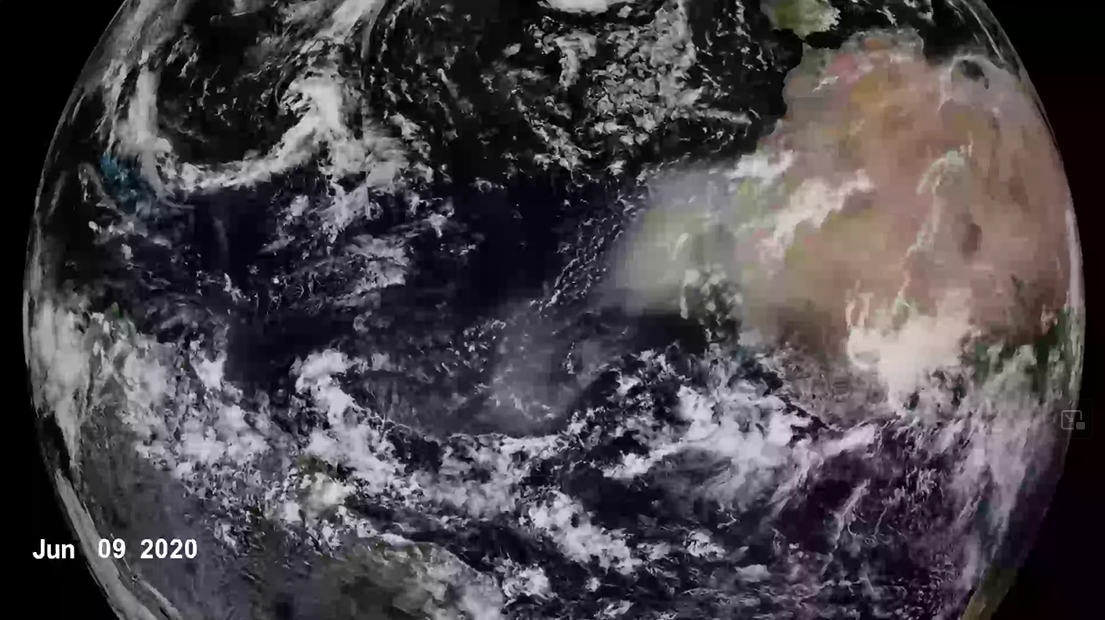
 In the Comparing Earth and Space Weather StoryMap, students learn the similarities and differences between weather here on Earth and space weather. They create their own Earth and space weather forecasts, modeling them around authentic, present-day data.
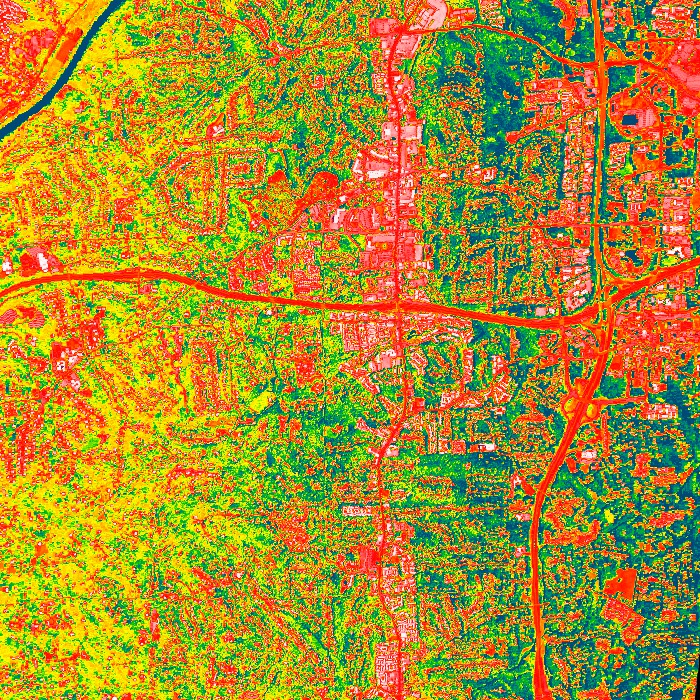 The Creation of the Urban Heat Island StoryMap engages students in the exploration of the urban heat island effect using land surface temperature and vegetation data. Students also investigate the processes that create differences in surface temperatures, as well as how human activities have led to the creation of urban heat islands.
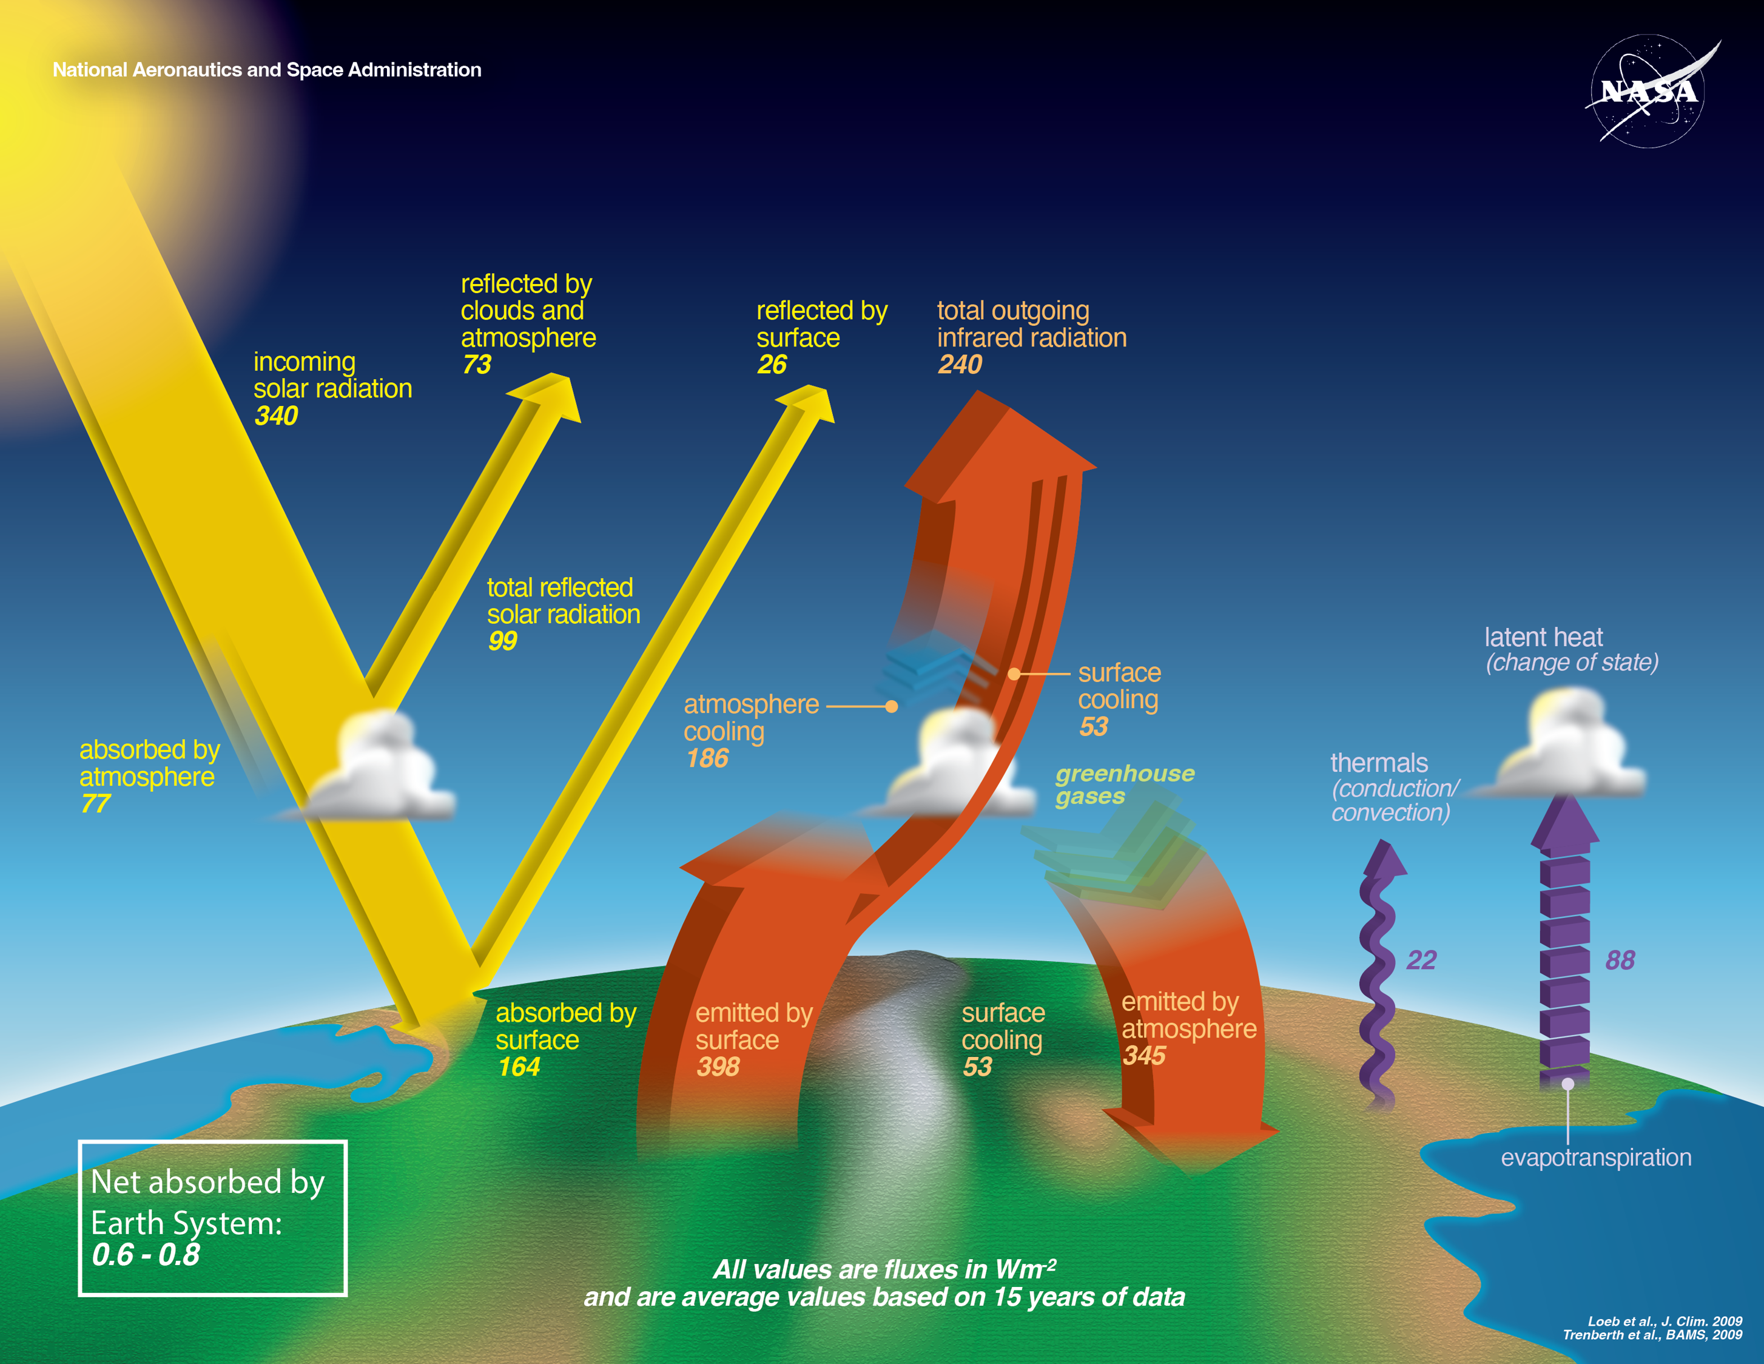
 In the Earth's Energy Budget StoryMap, students learn about the different components of the Earth's Energy Budget, where in the Earth System energy is being absorbed and reflected, and how features of the Earth such as clouds, aerosols, and greenhouse gases, can cause variations in the flow of energy into and out of Earth Systems.
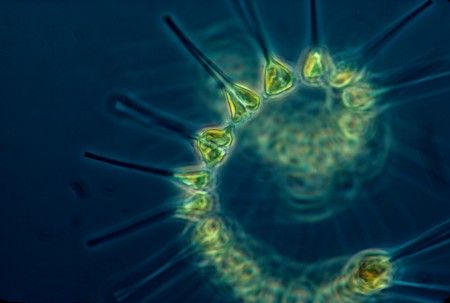 In the Global Phytoplankton Distribution StoryMap, students use chlorophyll concentration data to explore global distribution patterns of phytoplankton. Students also investigate the processes that allow phytoplankton populations to thrive, as well as how their role in the carbon cycle affects the other spheres of the Earth System.
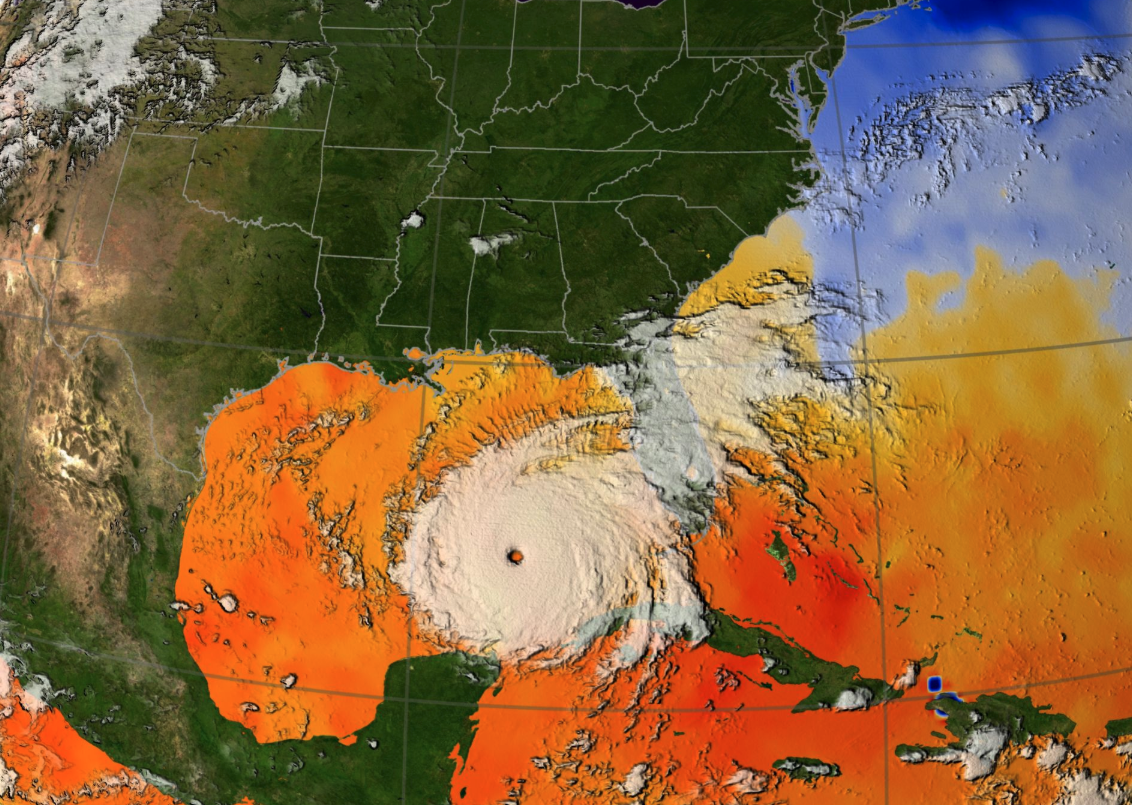 In the Hurricanes as Heat Engines StoryMap, students use various visualizations (i.e. images, charts, and graphs) to explore the energy exchange that occurs when hurricanes extract heat energy from the ocean. Using sea surface temperature data, they simulate the conditions that allow hurricanes to form, and observe the effects of hurricanes on the Earth System.
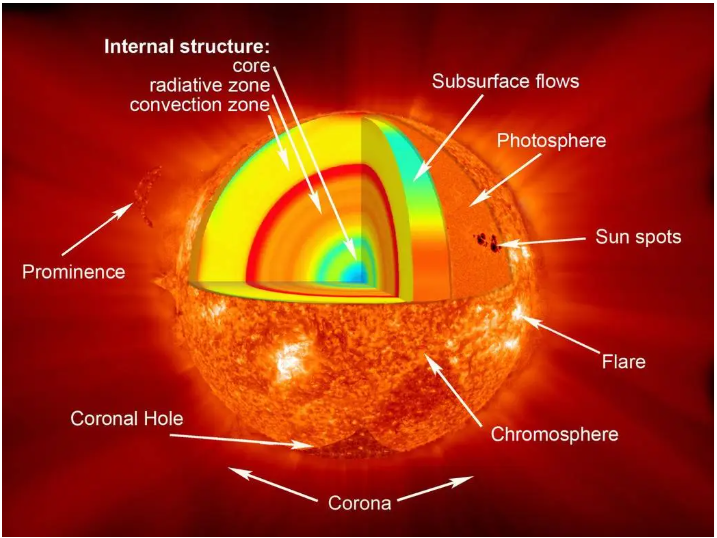
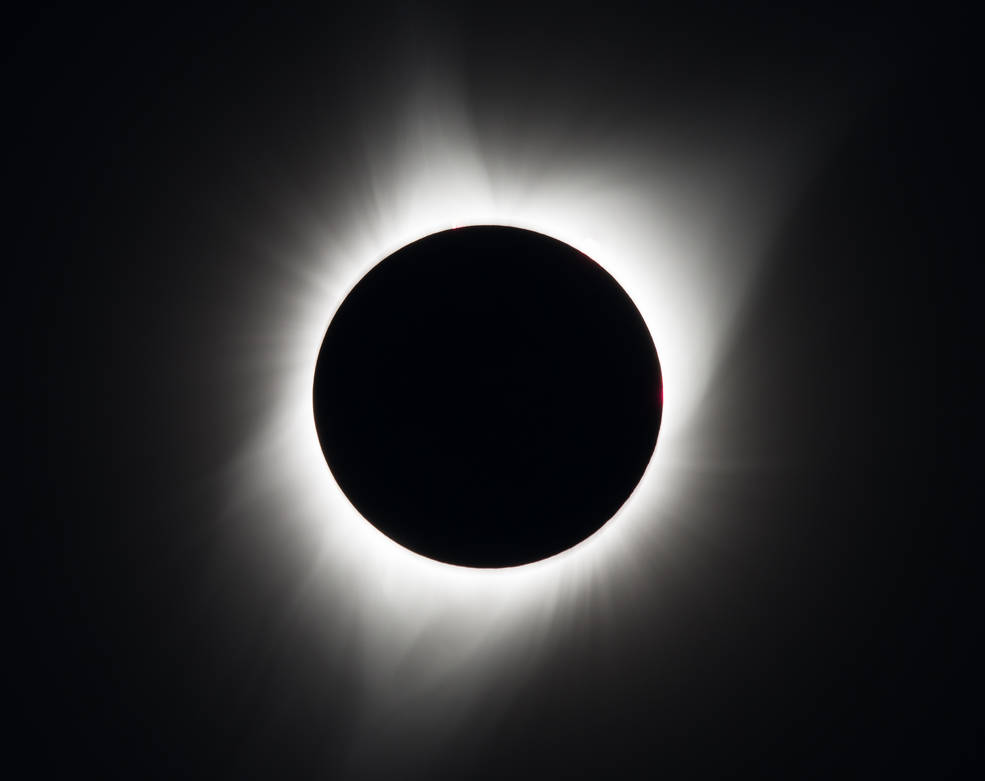
- In the Learning from Stars and Solar Eclipses StoryMap, students explore how
 living with a star can teach us about our universe. Through a series of learning activities, students examine the benefits and hazards of living with a star, describe and/or demonstrate how we use eclipses to study the Sun and its features, and investigate how our Sun may be used to learn about other stars and our universe.
 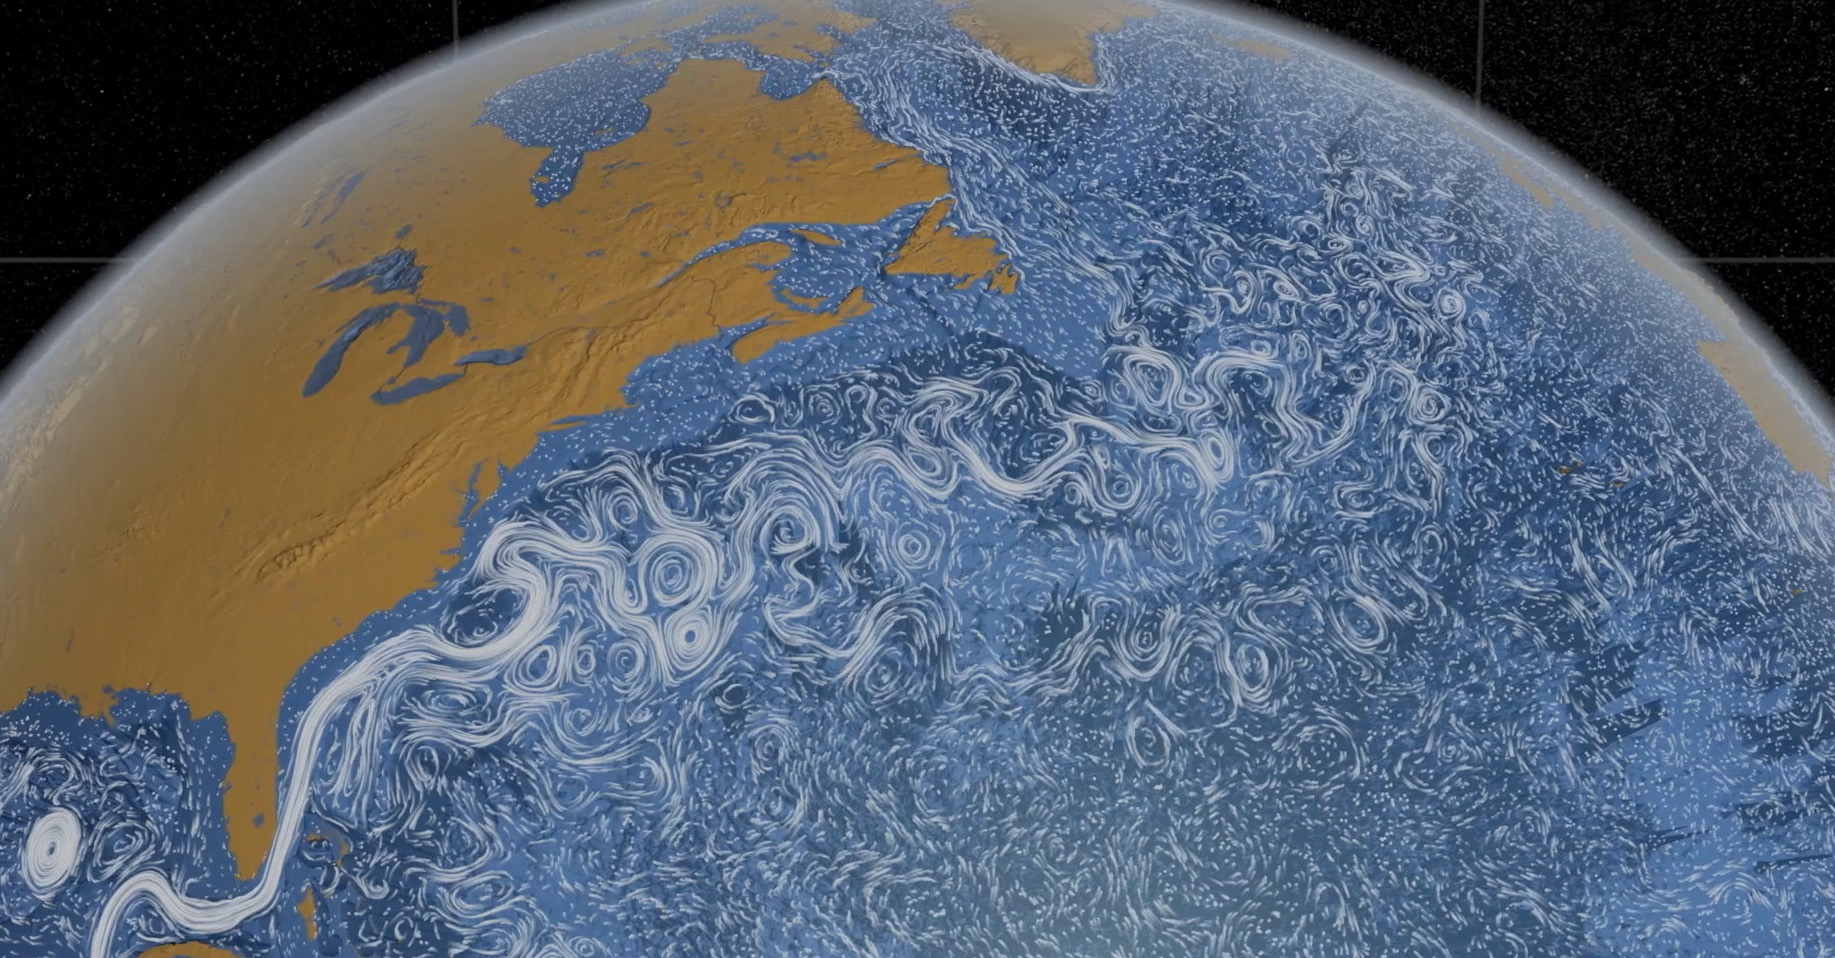 In the Ocean Circulation Patterns StoryMap, students analyze ocean circulation patterns as they relate to the world's ocean garbage patches using NASA ocean currents data. Students investigate the forces that contribute to ocean circulation patterns, and how debris, especially plastics, travel from land to garbage patches, as well as how humans have contributed to ocean plastic pollution.
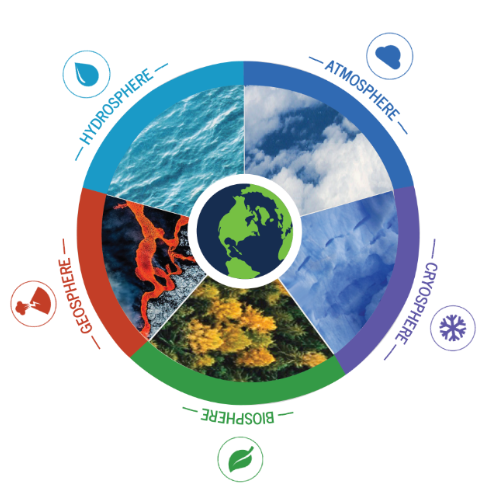
 In the Sea Ice Extent and the Earth System StoryMap, students explore changes in sea ice extent as it relates to other spheres within the Earth System. They also develop an iterative concept map that they will use to document their understanding of the Earth System as it relates to changes in sea ice.
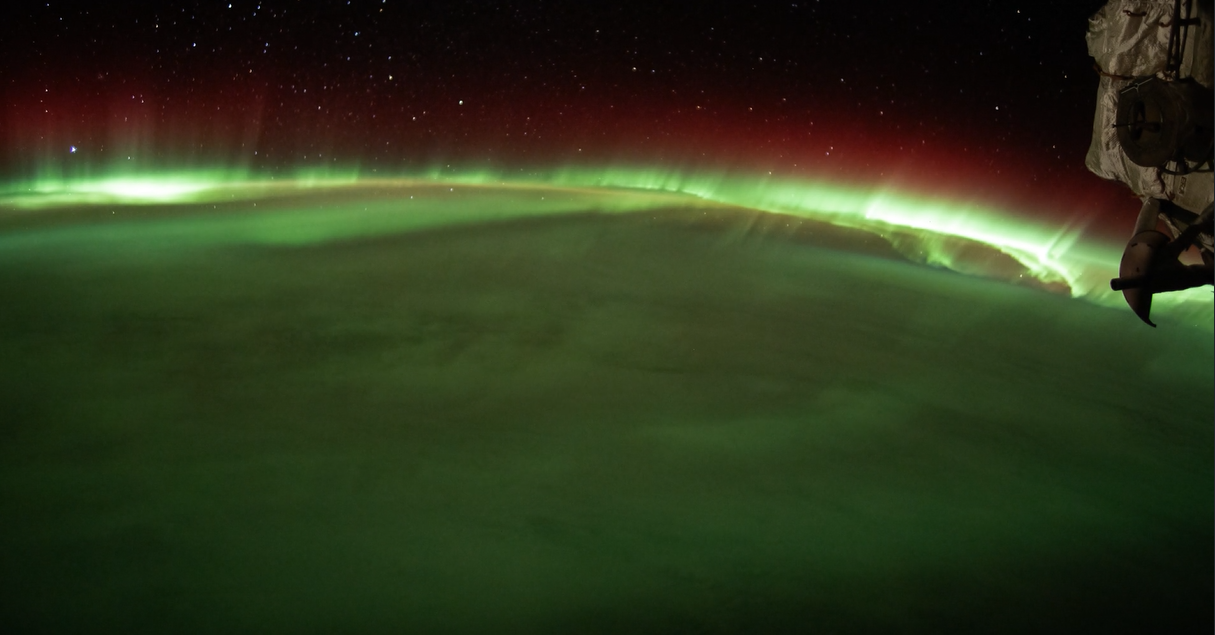 The Space Weather StoryMap engages students in the exploration of space weather using data collected by NASA missions. Students identify causes and effects of space weather, including how it can affect life on Earth, and analyze space weather data.
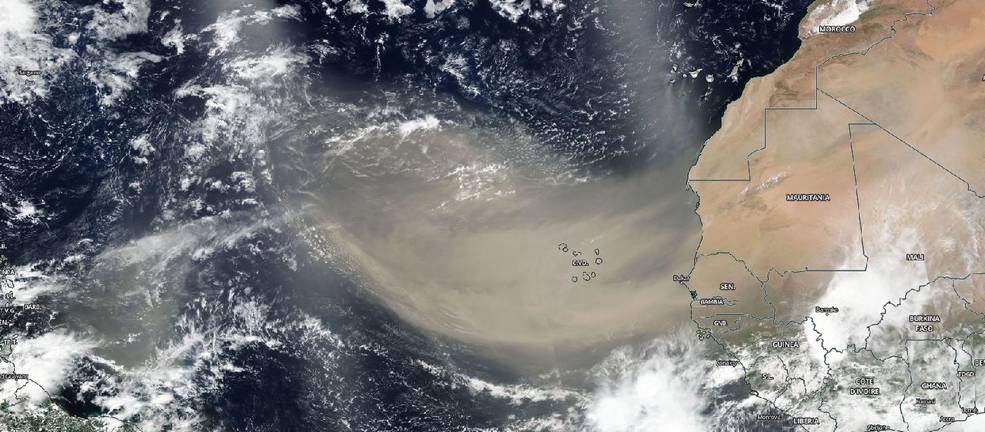
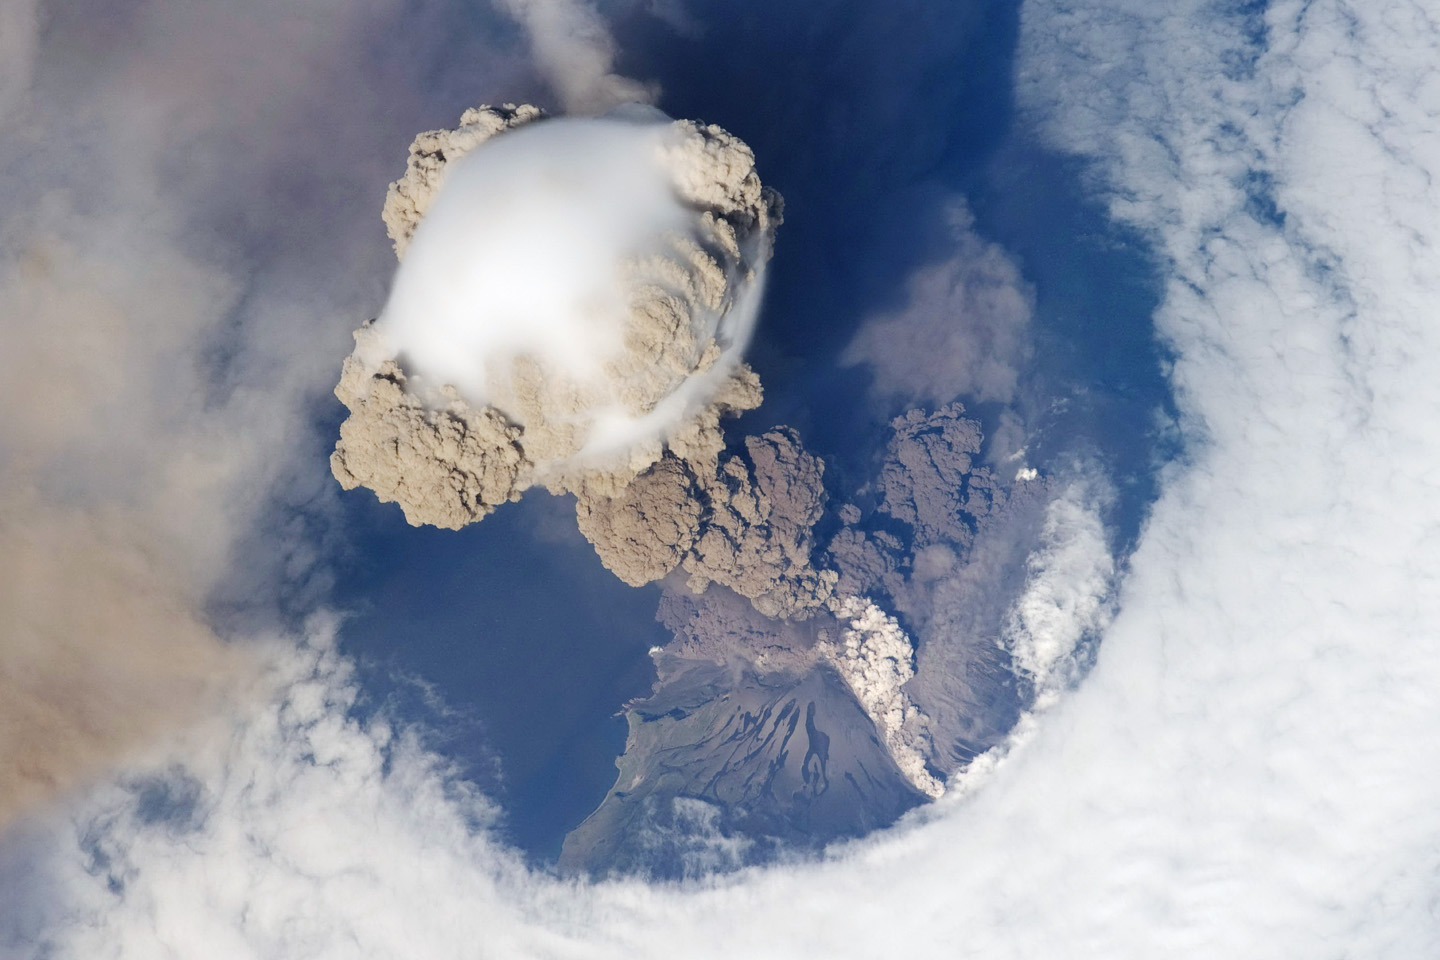 In the Volcanic Eruptions StoryMap, students explore the formation and impacts of ash and aerosols from volcanic eruptions around the world. They also investigate how ash and aerosols produced from volcanic eruptions are hazardous to the human ecosystem. Students graph the concentrations of aerosols from a volcanic eruption over time.
Disciplinary Core Ideas:
Crosscutting Concepts:
- Patterns
- Cause and Effect
- Scale, Proportion, and Quantity
- Systems and System Models
- Stability and Change