Interactive Models
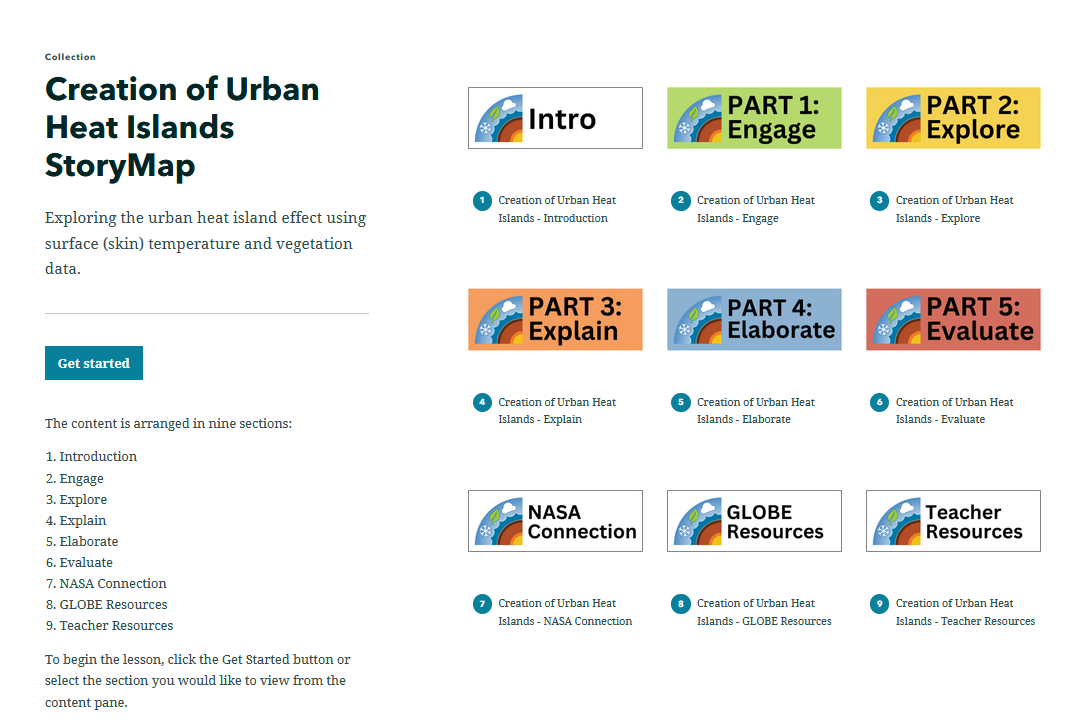
Creation of Urban Heat Islands StoryMap
Overview
By interacting with various visualizations (i.e., images, charts, and graphs), students explore the urban heat island effect using land surface temperature and vegetation data. Students will investigate the processes that create differences in surface temperatures, as well as how human activities have led to the creation of urban heat islands.

Materials Required
Resources Needed Per Student:
- Student Data Sheet or Student Data Form
- Computer/Tablet
- Internet Access
- Link to Creation of Urban Heat Islands StoryMap
Directions
- Using an internet accessible device, students open the link to the Creation of Urban Heat Islands StoryMap Lesson to begin their exploration of this phenomenon.
- Distribute the Creation of Urban Heat Islands StoryMap Student Data Sheet. Have students navigate on their own through the Engage, Explore, Explain, Elaborate, and Evaluate tabs of the StoryMap to answer the questions and complete the activities on their student data sheet.
Teacher Note
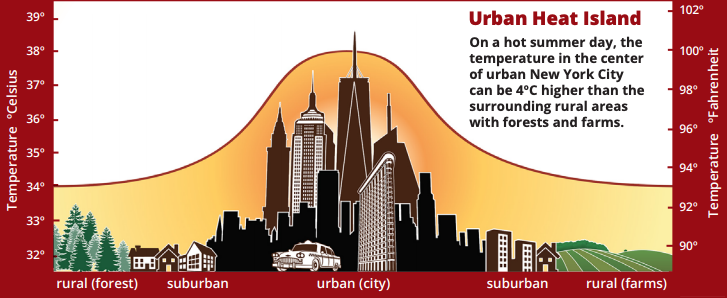
Heat islands form as vegetation is replaced by asphalt and concrete for roads, buildings, and other structures necessary to accommodate growing populations. These surfaces absorb—rather than reflect— the sun's heat, causing surface temperatures and near-surface air temperatures to rise near these surfaces. Displacing trees and vegetation minimizes the natural cooling effects of shading and evaporation of water from soil and leaves (evapotranspiration).
To learn more, visit:
- The Urban Heat Island Phenomena page for background information.
- Explain tab found in the StoryMap for more information.
While this StoryMap is intended to be used with students who have access to the internet in a 1:1 or 1:2 setting, teachers may pull various visualizations to use in singularity or may assign parts of this StoryMap without assigning the full resource. Please see our Google Forms and Sheet for tools that can be modified to fit your instructional needs. This Sheet, Embedded Activities for Upload, is a template that enables students to complete and upload activities that are featured in the Student Sheets (PDF) that cannot be completed in Google Forms.
Teachers who are interested in receiving the answer key, please complete the Teacher Key Request and Verification Form. We verify that requestors are teachers prior to sending access to the answer keys as we’ve had many students try to pass as teachers to gain access.
Disciplinary Core Ideas:
- PS3B: Conservation of Energy and Energy Transfer
- LS2B: Cycles of Matter and Energy Transfer in Ecosystems
- ESS2A: Earth Materials and Systems
- ESS3A: Natural Resources
- ESS3C: Human Impacts on Earth Systems
Crosscutting Concepts:
- Patterns
- Cause and Effect
- Systems and System Models
Science and Engineering Practices:
- Planning and Carrying out Investigations
- Analyzing and Interpreting Data
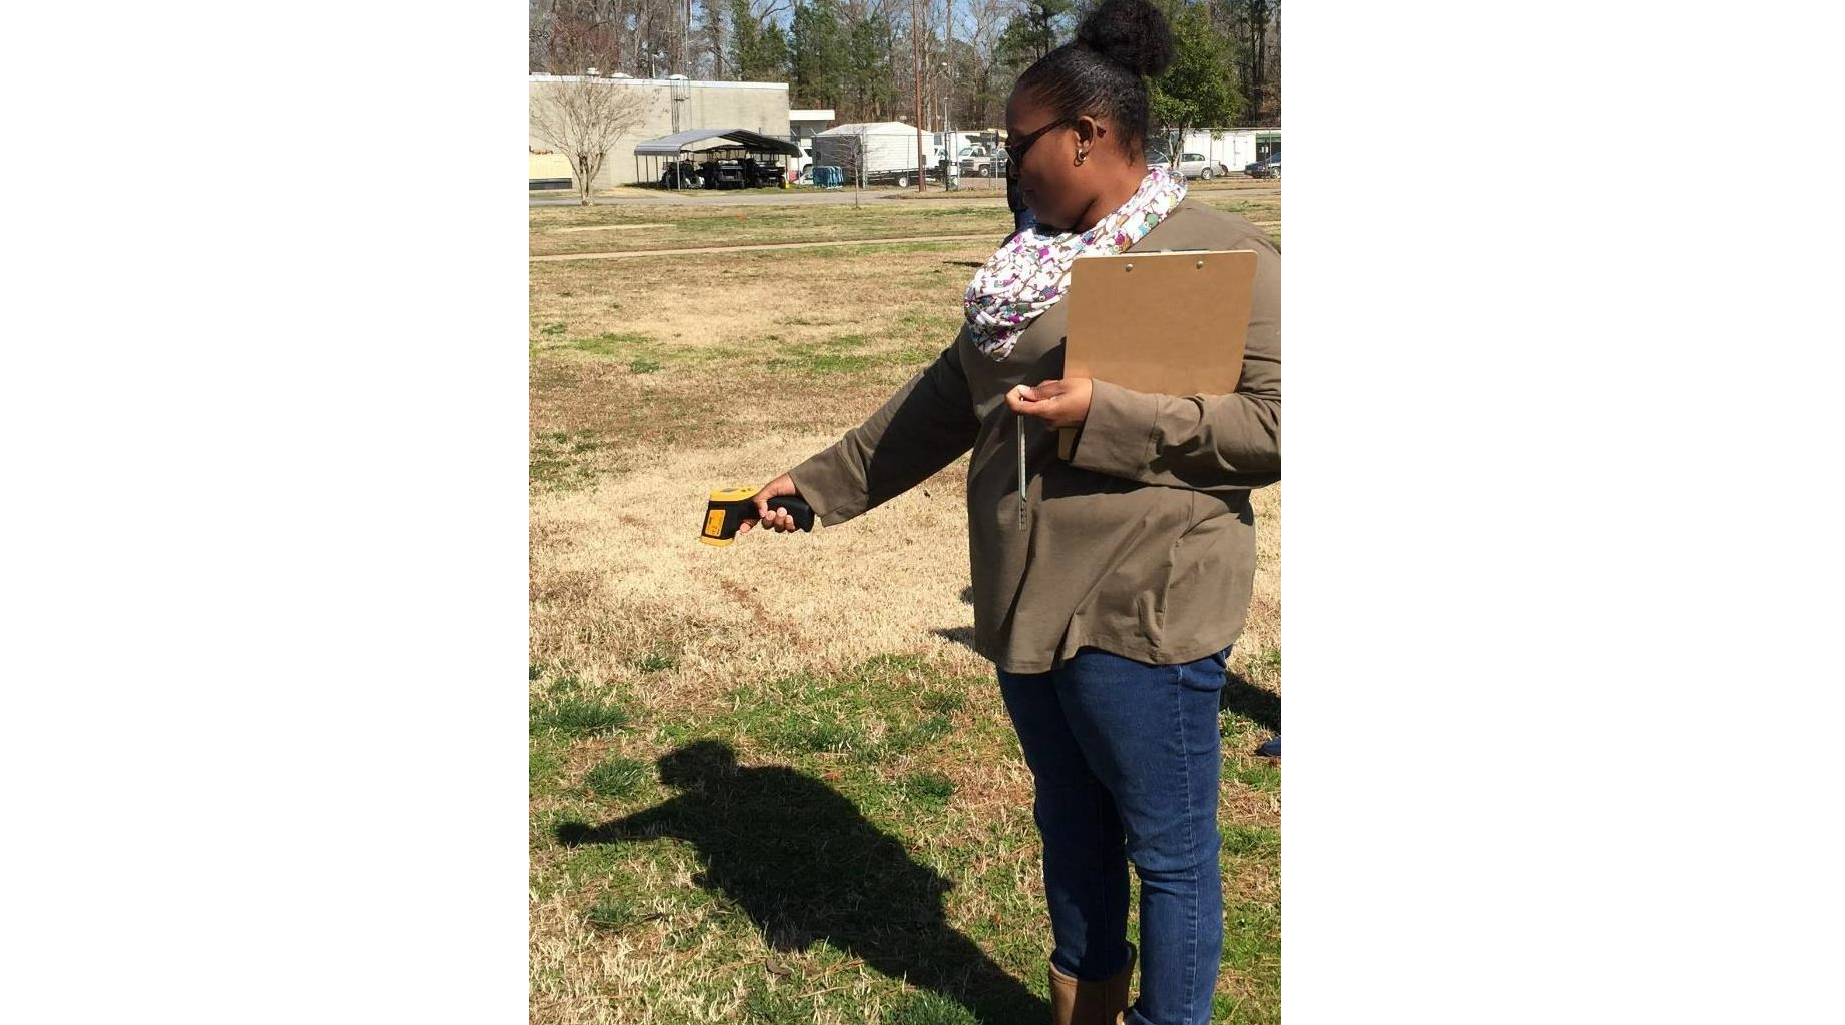
- Students will analyze surface temperature data to use as evidence to explain the urban heat island effect.
- Students will explore the role of Earth’s energy balance in the creation of urban heat islands.
- Students will evaluate examples of human activity that have led to the creation of urban heat islands.
- Why do different materials experience differences in surface temperature?
- What is the role of urban heat islands in Earth's energy balance?
- How has human activity led to the creation of urban heat islands?
National Geography Standards:
- How to use maps and other geographic representations, tools, and technologies to acquire, process, and report information from a spatial perspective.
- Internet Required
- One-to-One (tablet, laptop, or CPU)
- One-to-a-Group
- Visualization Tool Required
Complementary Mini Lessons
Complementary Lesson Plans


Document Resources
Grade Band
- 6-8
- 9-12
Time
- > 90 minutes
Visualization Tool
NGSS Three Dimensional Learning
- See drop-down menu at the bottom of the page