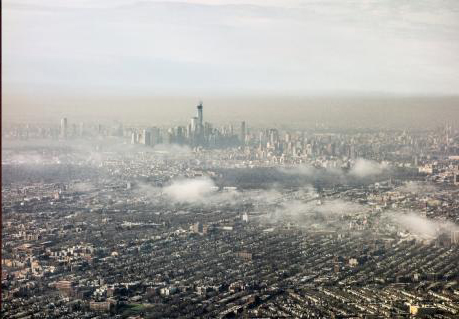
Air Quality

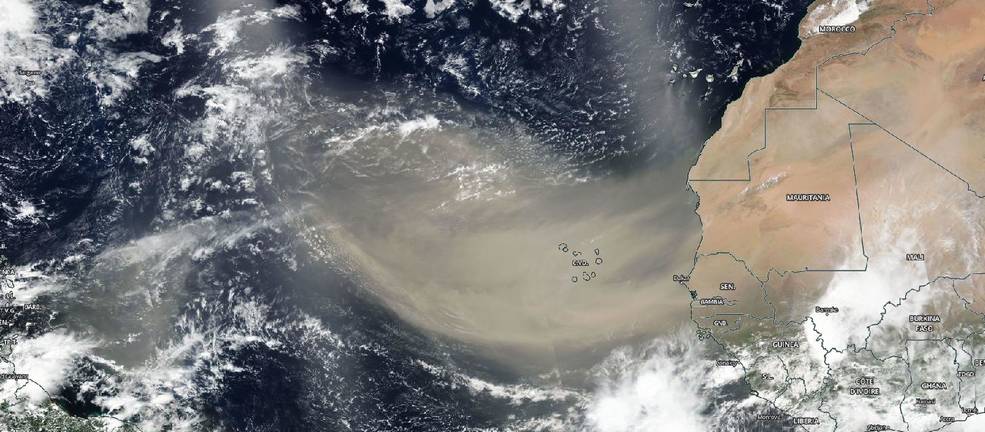
Image Credit: NOAA
What is Air Quality?
Air quality is a measure of the pollution level in the air. Monitoring air quality is important because polluted air can be bad for human health and the environment.
Sources of Air Pollution
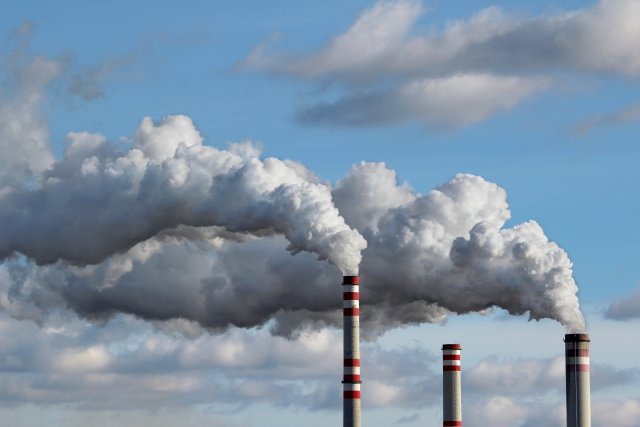
Pollutants are formed from both natural and human (anthropogenic) sources. Some examples of natural and anthropogenic sources are listed below.
Anthropogenic Sources
- Fuel combustion sources (such as electric utilities and boilers)
- Industrial processes (such as metal smelters, petroleum refineries, cement kilns and dry cleaners)
- Highway vehicles
- Other mobile sources (such as recreational and construction equipment, marine vessels, aircraft and locomotives)
Natural Sources
- Pollen
- Volcanoes (release of sulfates)
- Fires (release of organic/black carbon)
- Desert dust
- Sea salt
Monitoring Air Quality
Worldwide, air quality is monitored by a network of environmental agencies. The major air pollutants that are regulated by the Clean Air Act and are monitored to see if they meet the national air quality standards set by the EPA include:
- Particulate Matter, or Aerosols
- Ground Level Ozone, or Tropospheric Ozone
- Carbon Monoxide
- Sulfur Dioxide
- Nitrogen Dioxide
- Lead
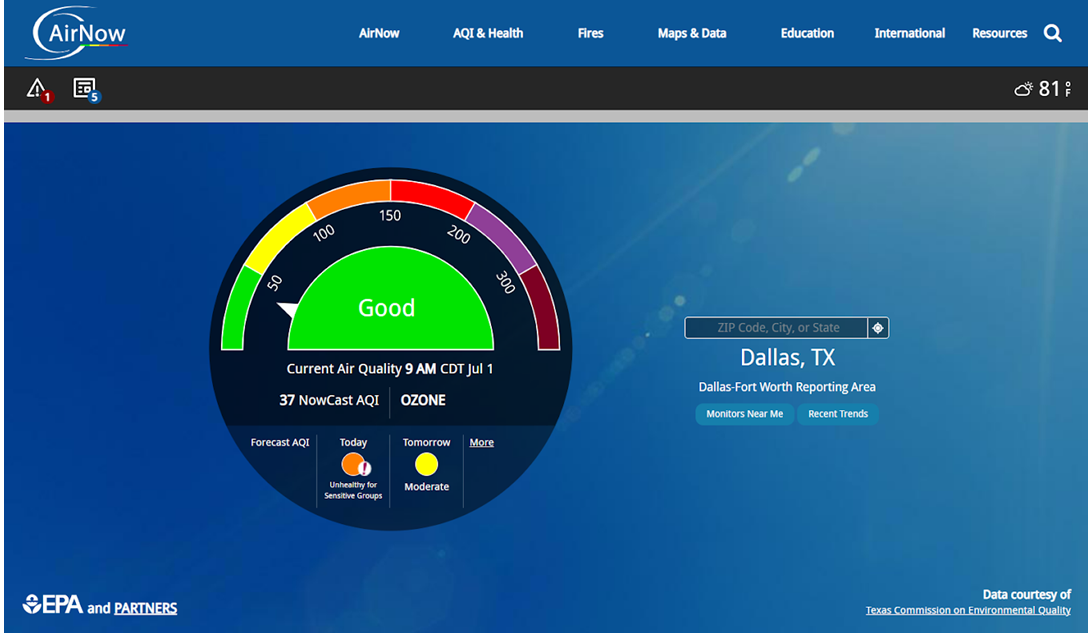
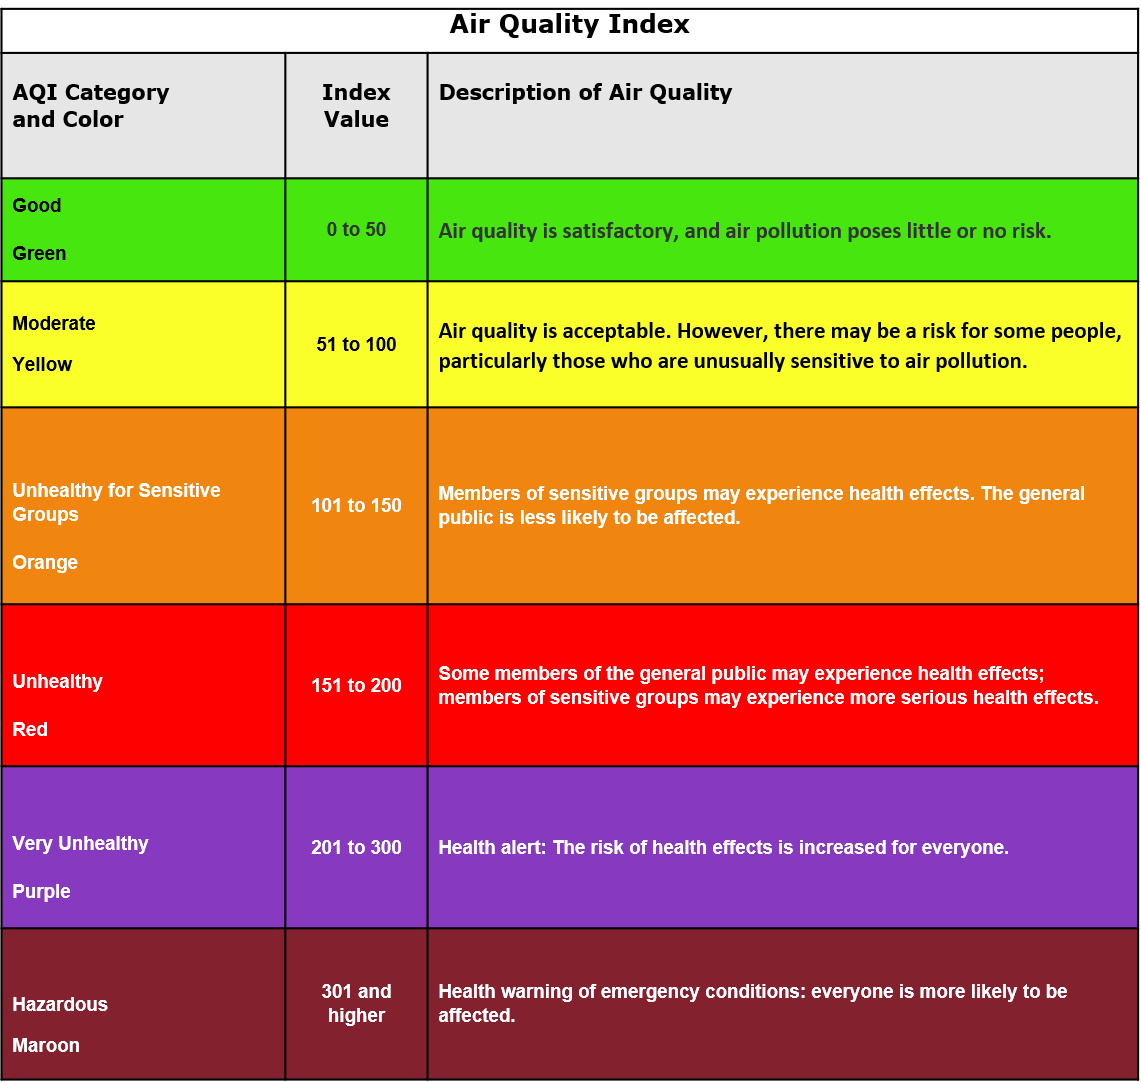
Air Quality Index
The overall air quality in an area is measured using the U.S. Environmental Protection Agency's Air Quality Index, or AQI. AQI is a unitless number, from 0 to 500, that communicates the health risk caused by the amount of pollution in the air. Higher AQI values relate to increased health risk.
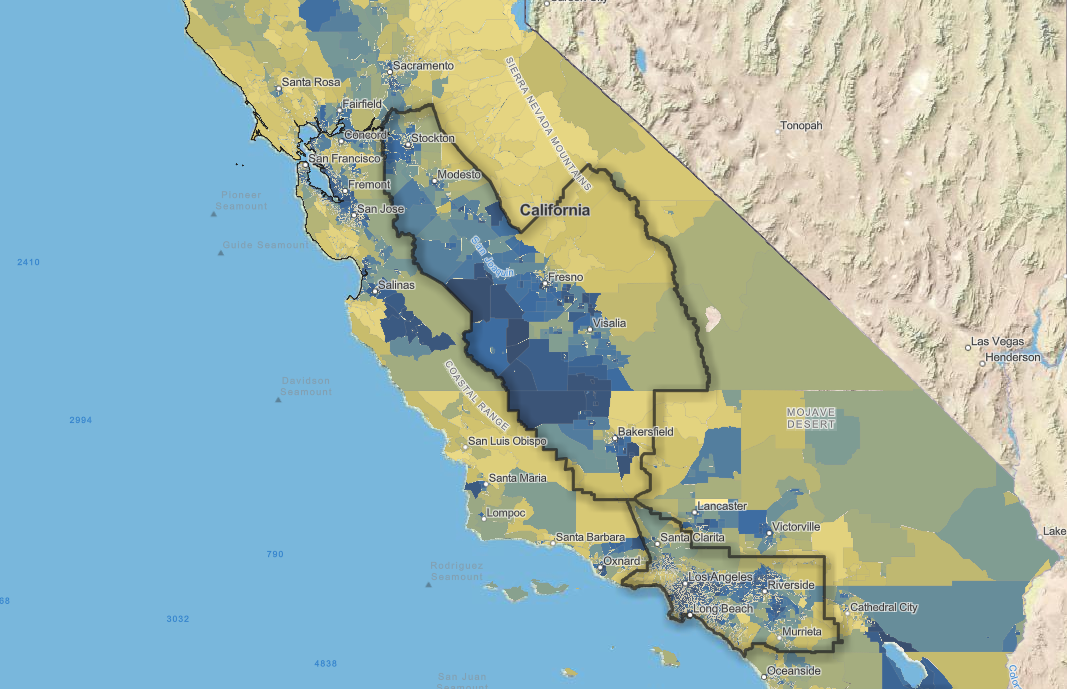
Air Quality Standards
For each pollutant, there is a standard concentration for meeting the standard determined by the National Ambient Air Quality Standards (NAAQS) set by the Clean Air Act. A location is evaluated by computing a series of average concentrations for a pollutant over hours, days, and years. If the average concentrations do not meet the air quality standard, then that location is considered a Nonattainment Area for that pollutant. This doesn't mean that Nonattainment Areas always have high pollution. They just have high pollution frequently enough that their average does not meet the standard. Likewise, areas that meet the standard and "pass" could still have days where the air quality is poor.
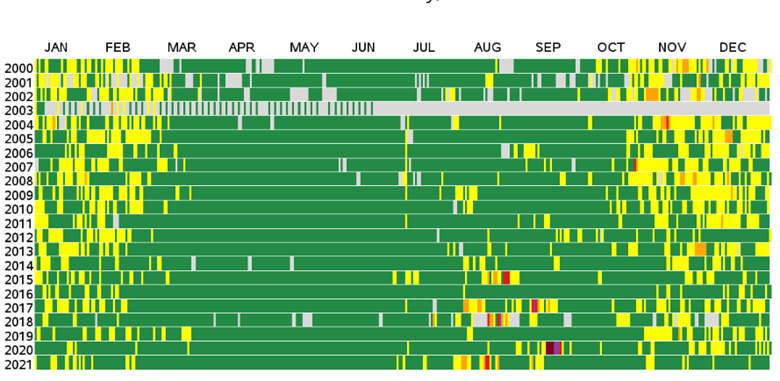
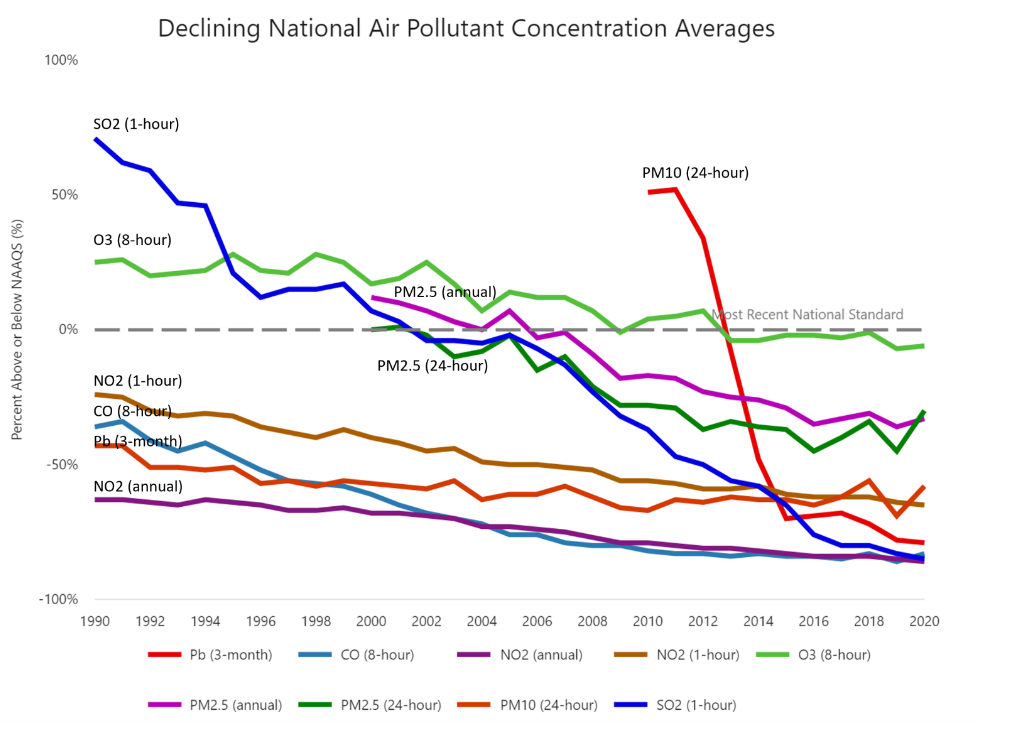
Trends in Air Quality
While air quality can exceed standards in specific locations on specific days, the overall air quality in the U.S. has improved since 1990.
Criteria Pollutants
The list below identifies the common sources of each criteria pollutant. In addition, primary and secondary sources are identified. Primary sources are directly emitted. Secondary sources are produced due to chemical reactions in the atmosphere. Due to chemical reactions in the atmosphere and winds, air pollution can be experienced in locations far from the original sources.
- Particulate Matter, or Aerosols
- Can be both primary and secondary pollutants
- Mixture of solid particles and liquid droplets suspended in the air
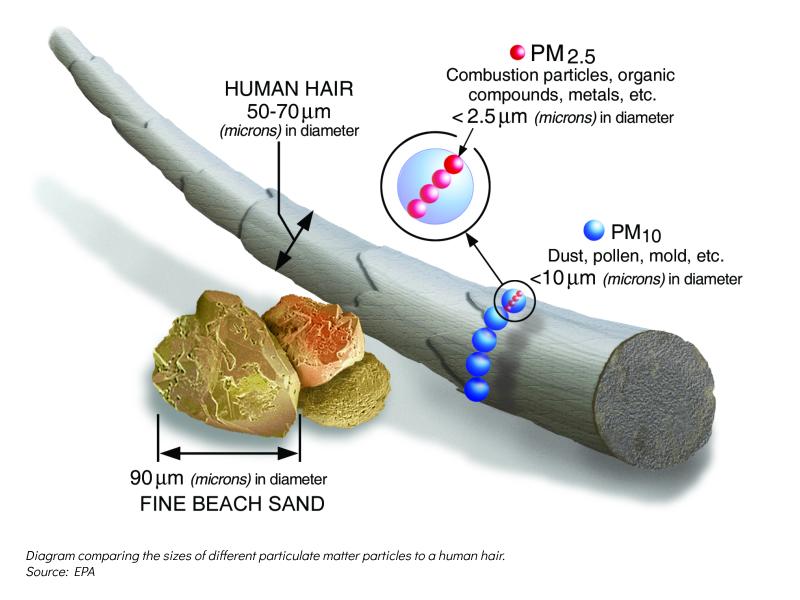
- Particulate matter, or PM, are in a range of sizes.
- Examples of larger particles (10 microns or smaller) include dust, pollen and mold
- Smaller particles (2.5 microns or smaller) come from combustion or organic compounds
- Some particulate matter is emitted directly from a source, such as construction sites, unpaved roads, fields, smokestacks or fires
- Most particles form in the atmosphere as a result of complex reactions of chemicals such as sulfur dioxide and nitrogen oxides, which are pollutants emitted from power plants, industries and automobiles.
- Ground Level Ozone, or Tropospheric Ozone
- Secondary pollutant
- Tropospheric ozone is created by chemical reactions between oxides of nitrogen (NOx), such as (NO2 ), and volatile organic compounds (VOC)
- Happens when pollutants emitted by cars, power plants, industrial boilers, refineries, chemical plants, and other sources chemically react in the presence of sunlight
- Carbon Monoxide
- Primary pollutant
- Carbon Monoxide (CO) is a colorless, odorless gas that is released when something is burned
- Greatest sources of CO to outdoor air are cars, trucks and other vehicles or machinery that burn fossil fuels
- Sulfur Dioxide
- Primary pollutant
- Largest source of sulfur dioxide (SO2 ) in the atmosphere is the burning of fossil fuels by power plants and other industrial facilities
- Smaller sources of SO2 emissions include: industrial processes such as extracting metal from ore; natural sources such as volcanoes; and locomotives, ships and other vehicles and heavy equipment that burn fuel with a high sulfur content
- Nitrogen Dioxide
- Primary pollutant
- Primarily gets in the air from the burning of fuel.
- NO2 forms from emissions from cars, trucks and buses, power plants, and off-road equipment
- Lead
- Primary pollutant
- Major sources of lead in the air are ore and metals processing and piston-engine aircraft operating on leaded aviation fuel
- Other sources are waste incinerators, utilities, and lead-acid battery manufacturers
- Highest air concentrations of lead are usually found near lead smelters
- This pollutant is monitored but is not part of the Air Quality Index because the effects of lead are cumulative
Health Effects of Air Pollution
Short and long-term exposure to air pollution has been associated with a wide range of human health effects including increased respiratory symptoms, and heart or lung diseases. Hazardous (or toxic) air pollutants may cause cancer or other serious health effects.
Environmental Effects of Air Pollution
Harm to Animals and Plants
Air pollution can affect many parts of the environment. It can cause damage to plants and the respiratory systems of animals. It can also cause damage to entire habitats, water, or food sources that plants and animals need to survive.
Acid Rain
Acid rain forms when sulfur dioxide and nitrogen dioxide mix with water droplets in the atmosphere to make sulfuric acid and nitric acid. When the pollutants fall to the surface as acid rain, they can acidify the water and soil environments, damage vegetation, and even damage buildings and outdoor structures.
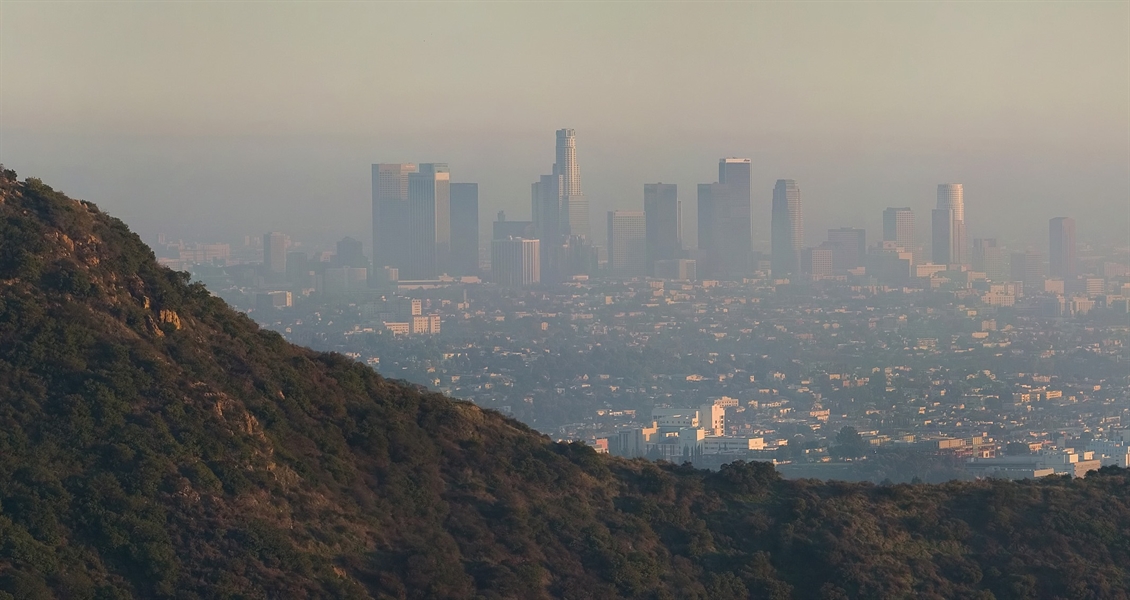
Haze
Haze is caused when sunlight encounters tiny pollution particles in the air. Haze obscures the clarity, color, texture, and form of what we see.
Ozone Depletion
Depending on where ozone resides, it can protect or harm life on Earth. Most ozone resides in the stratosphere (a layer of the atmosphere between 10 and 31 miles above us), where it acts as a shield to protect Earth's surface from the sun's harmful ultraviolet radiation. This portion of ozone is ofter referred to as "good ozone." In the troposphere (the atmospheric layer from the surface up to about 10 miles), ozone is a harmful pollutant that causes damage to lung tissue and plants. This type of ozone is often referred to as "bad ozone". Scientists have found that the "bad" tropospheric ozone is increasing in the air we breathe, and the "good" stratospheric ozone is decreasing in our protective ozone layer.
Air Quality & NASA Science Missions
NASA has several missions that make observations and measurements related to air quality. Some of these are included below.
Current Missions
-
AERONET: The AErosol RObotic NETwork is a global network of ground-based sun photometers that measure the amount of sunlight transmitted through the atmosphere. These measurements can then be used to determine Aerosol Optical Depth (AOD), and can also provide information about the size and type of aerosols in the atmospheric column.
-
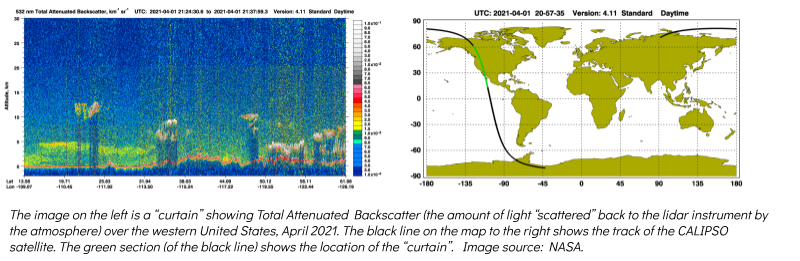
CALIPSO: The Cloud-Aerosol Lidar and Infrared Pathfinder Satellite Observation satellite, launched in 2006, makes measurements of clouds and aerosols, and helps provide information on their effect on the Earth’s weather and climate. CALIPSO includes a lidar instrument that provides high-resolution vertical profiles of the atmosphere. Data visualizations from CALIPSO are available.
-
MODIS: The Moderate Resolution Imaging Spectroradiometer is an instrument that flies aboard the Terra and Aqua satellites. MODIS instruments are able to “see” the entire Earth every 1 - 2 days, collecting data across 36 different wavelengths. Data from MODIS provides insight into how clouds and aerosols affect the Earth’s energy budget, as well as the properties of atmospheric aerosols. MODIS data can be added as a base layer in the GLOBE Visualization tool and viewed with GLOBE observations. The base layer name is Corrected Reflectance - True Color (Terra).
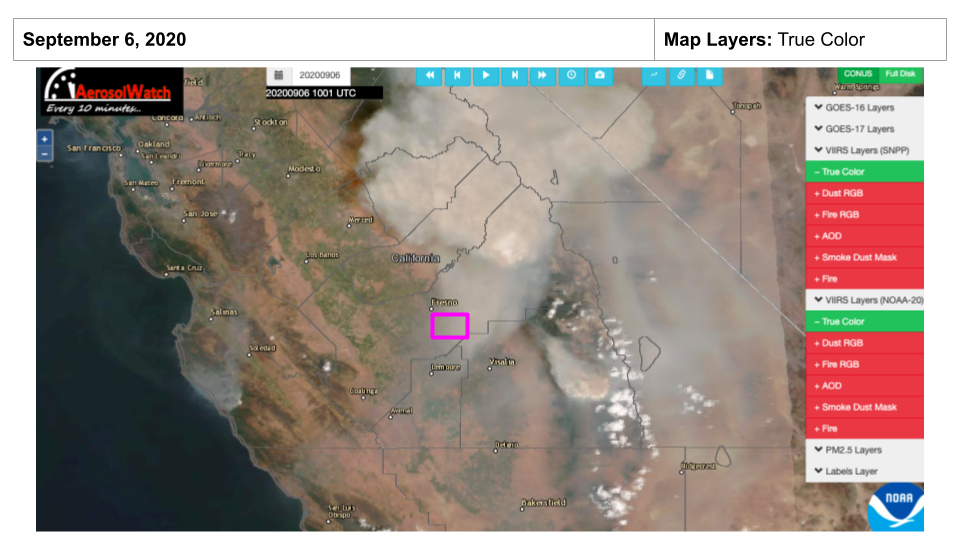
- VIIRS: The Visible Infrared Imaging Radiometer Suite is an instrument that flies on the Suomi-NPP and NOAA-20 satellites. Both satellites are polar-orbiting, circling the Earth about 14 times a day. VIIRS collects data across 22 wavelengths, providing information about clouds and aerosols, and helping to detect wildfires. VIIRS satellite images are available on the AerosolWatch website.
Upcoming Missions
-
MAIA: The Multi-Angle Imager for Aerosols instrument, which will fly aboard the Orbital Test Bed (OTB) - 2 satellite, is scheduled to launch in 2022. MAIA will study the effects of particulate matter on human health in both the short term and the long term, and will also collect data on naturally occurring and anthropogenic air quality events.
-
PACE: The Plankton, Aerosol, Cloud ocean Ecosystem satellite, scheduled to launch in 2022, will continue NASA’s efforts to observe the Earth’s oceans. PACE will carry two primary instruments. The first, an ocean color instrument, will collect data on global ocean biology. The second, multi-angle polarimeters, will measure how sunlight changes as it passes through clouds, aerosols and the ocean, providing detailed information about the Earth’s atmosphere and oceans.
-
TEMPO: The Tropospheric Emissions: Monitoring of Pollution instrument, which will fly aboard the geostationary Intelsat 40e, is scheduled to launch in 2022. TEMPO will use a spectrometer to make hourly measurements of ozone, nitrogen dioxide and other air pollutants across North America.