Mini Lesson/Activity
Multiyear Time Plots for Air Quality Data
Overview
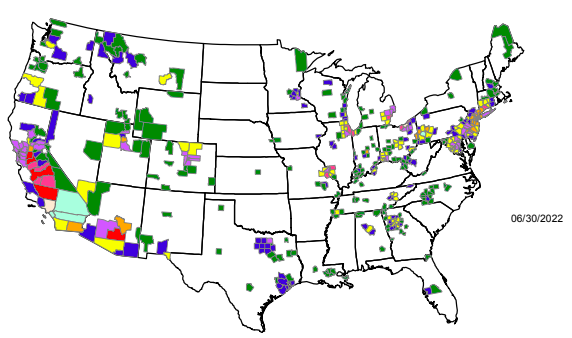
Students observe how air quality changes over time, for a selected location, using data from the United States Environmental Protection Agency (EPA).
Student Directions
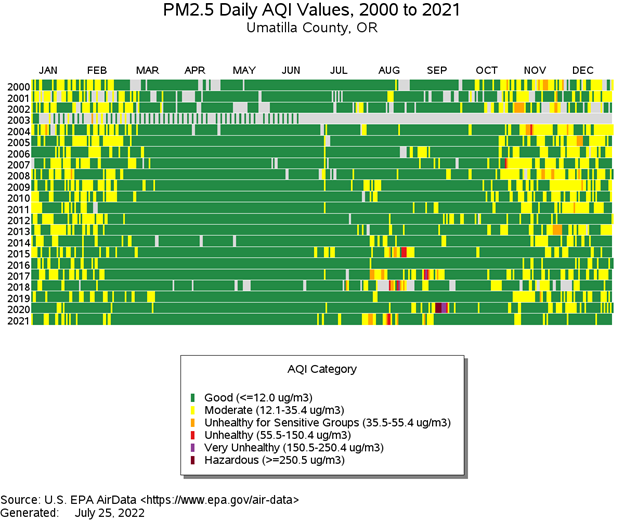
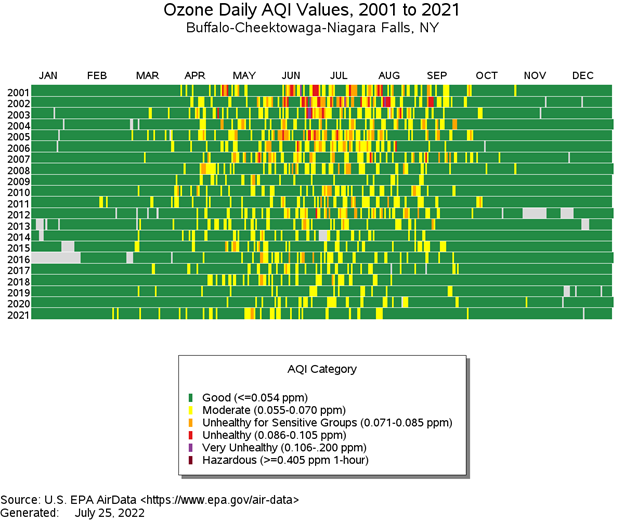
The time plot below shows PM 2.5 data for Umatilla Country in Eastern Oregon from 2000-2021 from the United States Environmental Protection Agency (EPA). The second time plot shows PM 2.5 data for Buffalo, New York and has a very different pattern from the first tile plot.
Identify data or patterns that you think are important to understanding the air quality for both areas. Make a claim supported by evidence and your reasoning for this collection of data for each plot.
Steps:
- Check with your instructor on how to submit your answers.
- Study the tile plot for Oregon and identify:
- The month and year with hazardous air quality.
- Months that regularly have good air quality.
- Months that have more potential for poor air quality.
- Make a claim based on the data from Umatilla Country, Oregon.
- What is your evidence?
- What makes this good evidence?
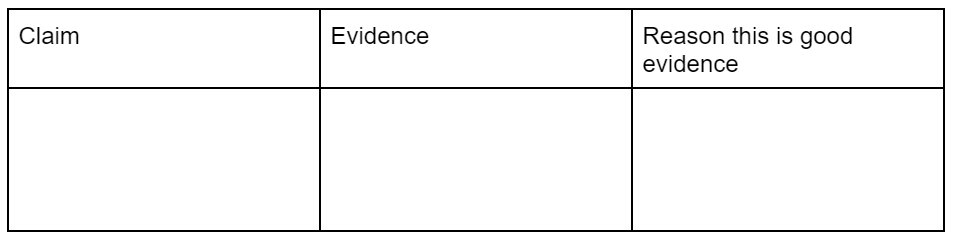
- Fill in the Claims-Evidence-Reasoning table.

- Study the tile plot for Buffalo and make a claim based on the data from Buffalo, New York.
- What is your evidence?
- What makes this good evidence?
- Fill in the Claims-Evidence-Reasoning table.
Source:
- Air Data - AQI Plot | US EPA. (2021, December 29). Environmental Protection Agency. Retrieved August 31, 2022, from https://www.epa.gov/outdoor-air-quality-data/air-data-aqi-plot
Teacher Note
Teachers, these mini lessons/student activities are perfect "warm up" tasks that can be used as a hook, bell ringer, exit slip, etc. They take less than a class period to complete. Learn more on the "My NASA Data What are Mini Lessons?" page.
Teachers who are interested in receiving the answer key, please complete the Teacher Key Request and Verification Form. We verify that requestors are teachers prior to sending access to the answer keys as we’ve had many students try to pass as teachers to gain access.
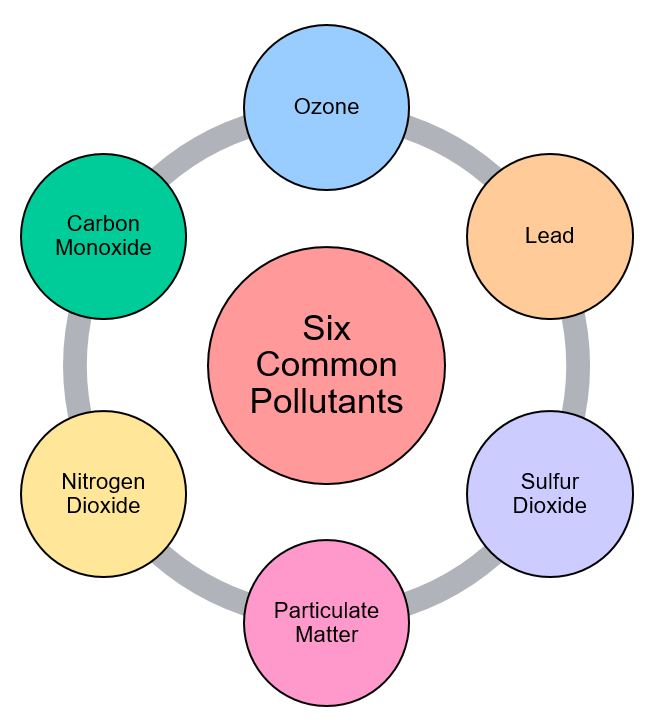
Disciplinary Core Ideas:
- ESS3C: Human Impacts on Earth Systems
Crosscutting Concepts:
- Patterns
Science and Engineering Practices:
- Developing and Using Models
- Analyzing and Interpreting Data
Complementary Mini Lessons

Complementary Interactives
Complementary Lesson Plans


Document Resources
Interactive Files
Grade Band
- 6-8
Time
- 30 minutes
Visualization Tool
NGSS Three Dimensional Learning
- See drop-down menu at the bottom of the page