
Grade Level: 6-8,
9-12
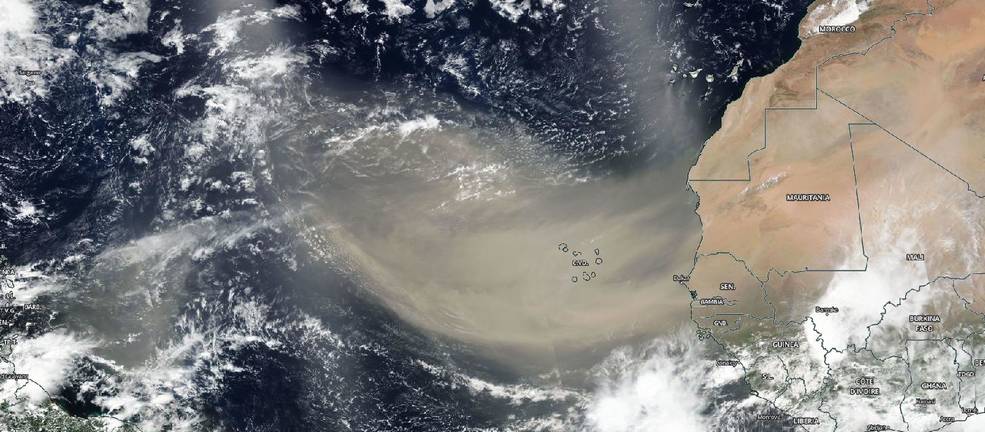
In this StoryMap students will learn about what air pollution is, its environmental impact, the standards used to describe air quality as defined by the Clean Air Act, and the Earth System interactions that drive the transport of air pollution.