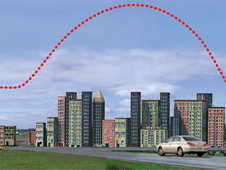
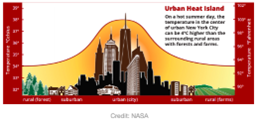
An urban heat island is a phenomenon that is best described when a city experiences much warmer temperatures than in nearby rural areas. The sun’s heat and light reach the city and the country in the same way. The difference in temperature between urban and less-developed rural areas has to do with how well the surfaces in each environment absorb and hold heat.
>> Read More >>
Just one moment,
loading Atmosphere...
Featured Lesson Plans
-
-
-
-
-
-
Grade Level: 3-5
In this activity, students explore the Urban Heat Island Effect phenomenon by collecting temperatures of different materials with respect to their locations. This activity was modified from The NASA PUMAS Collection's "What makes
Grade Level: 6-8
In this NASA investigation, "What's Hot at the Mall," students examine how shopping malls change natural environments by examining thermal images gathered by NASA showing an area in Huntsville, Alabama.
Grade Level: 6-8, 9-12
To investigate the different rates of heating and cooling of certain materials on earth in order to understand the heating dynamics that take place in the Earth’s atmosphere.
Grade Level: 6-8
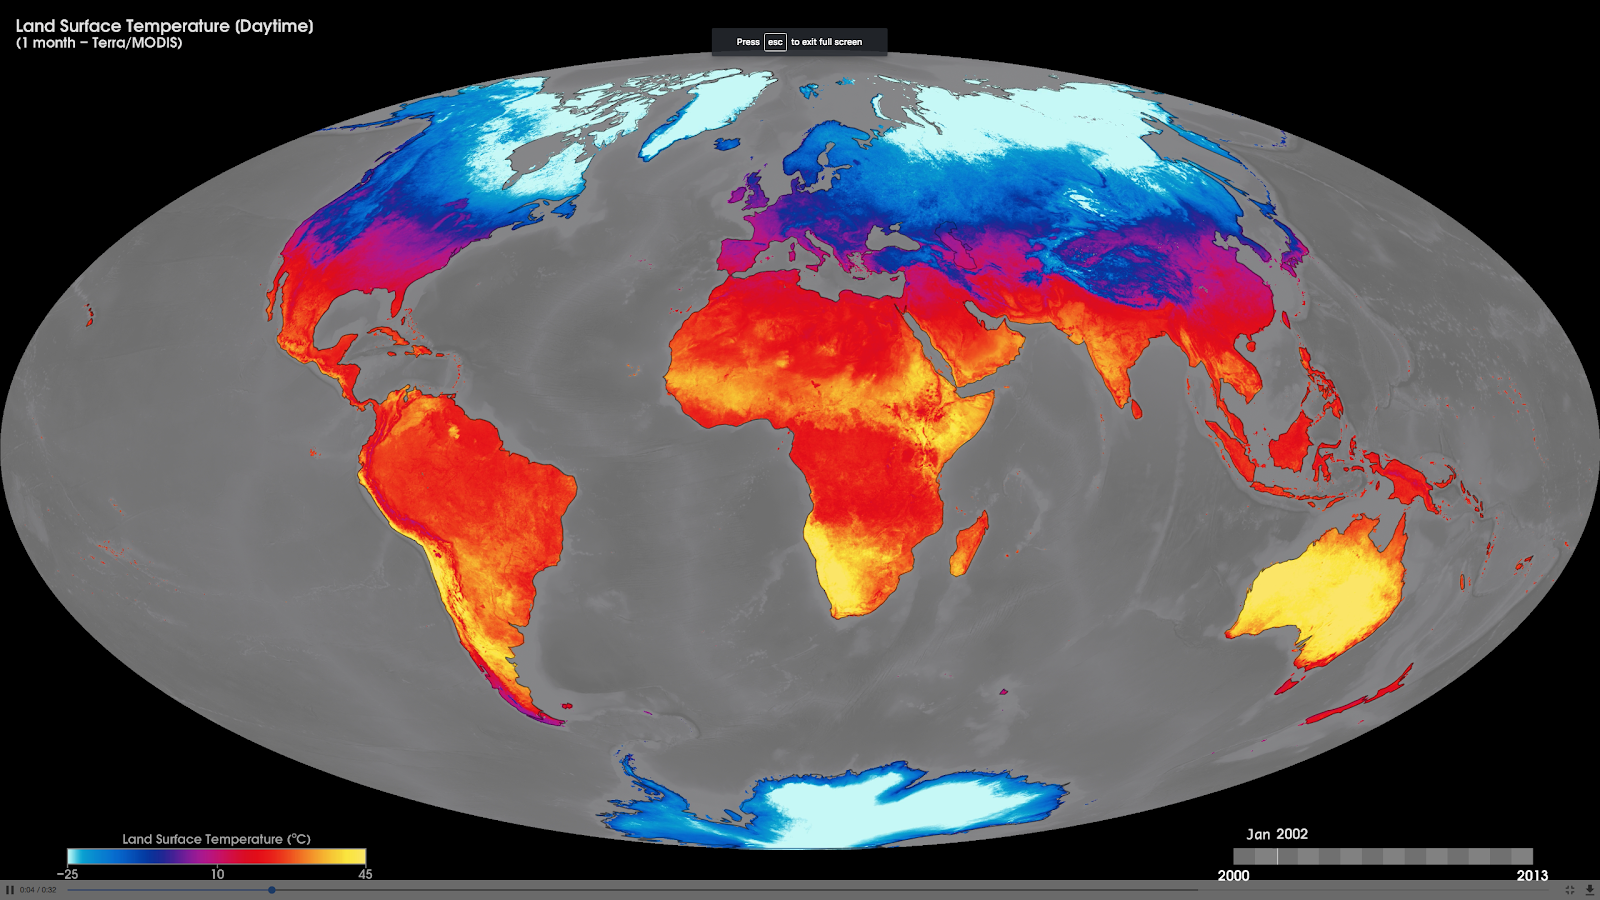
Examine (daytime) surface temperature and solar radiation received at locations found near similar latitudes using NASA Data.
Grade Level: 3-5, 6-8, 9-12
Students will analyze and interpret graphs to compare the flow of (shortwave) energy from the Sun toward China over the course of a year on cloudy versus clear days. Students will draw a conclusion and support it with evidence.
Grade Level: 6-8, 9-12
Students will analyze and interpret maps of the average net atmospheric radiation to compare the flow of energy from the Sun toward Earth in different months and for cloudy versus clear days. Students will draw conclusions and support them with evidence.
Previous
Next
Grade Level: 3-5
In this activity, students explore the Urban Heat Island Effect phenomenon by collecting temperatures of different materials with respect to their locations. This activity was modified from The NASA PUMAS Collection's "What makes
Grade Level: 6-8
In this NASA investigation, "What's Hot at the Mall," students examine how shopping malls change natural environments by examining thermal images gathered by NASA showing an area in Huntsville, Alabama.
Grade Level: 6-8,
9-12
To investigate the different rates of heating and cooling of certain materials on earth in order to understand the heating dynamics that take place in the Earth’s atmosphere.
Grade Level: 6-8
Examine (daytime) surface temperature and solar radiation received at locations found near similar latitudes using NASA Data.
Grade Level: 3-5,
6-8,
9-12
Students will analyze and interpret graphs to compare the flow of (shortwave) energy from the Sun toward China over the course of a year on cloudy versus clear days. Students will draw a conclusion and support it with evidence.
Grade Level: 6-8,
9-12
Students will analyze and interpret maps of the average net atmospheric radiation to compare the flow of energy from the Sun toward Earth in different months and for cloudy versus clear days. Students will draw conclusions and support them with evidence.
Grade Level: 6-8,
9-12
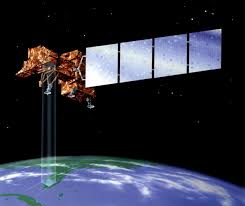
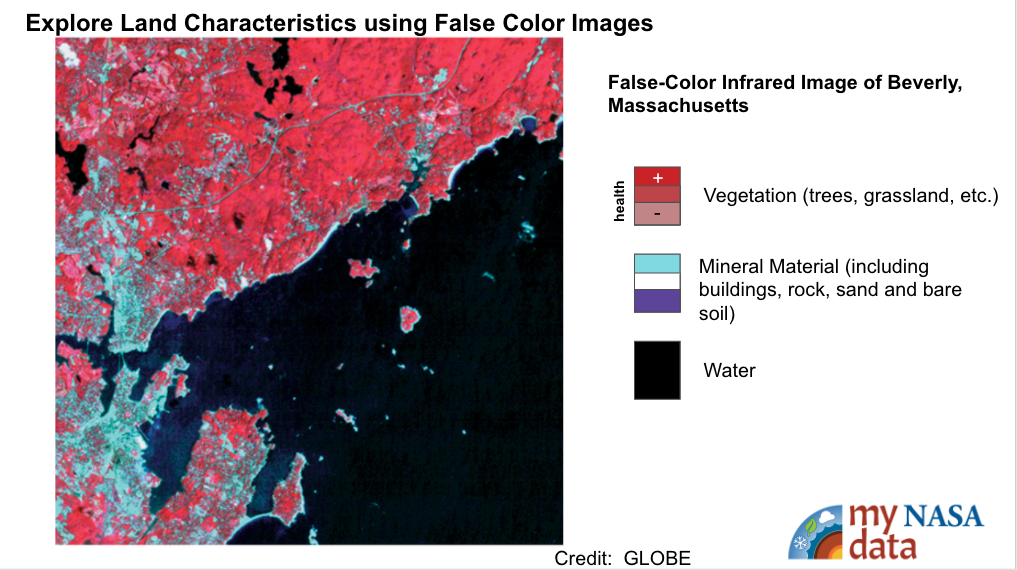
Students identify and classify kinds of land cover (such as vegetation, urban areas, water, and bare soil) in Landsat satellite images of Phoenix, Arizona taken in 1984 and 2018.
Grade Level: 6-8,
9-12
This lesson walks students through the use of Landsat false-color imagery and identification of different land cover features using these as models.
Grade Level: 9-12
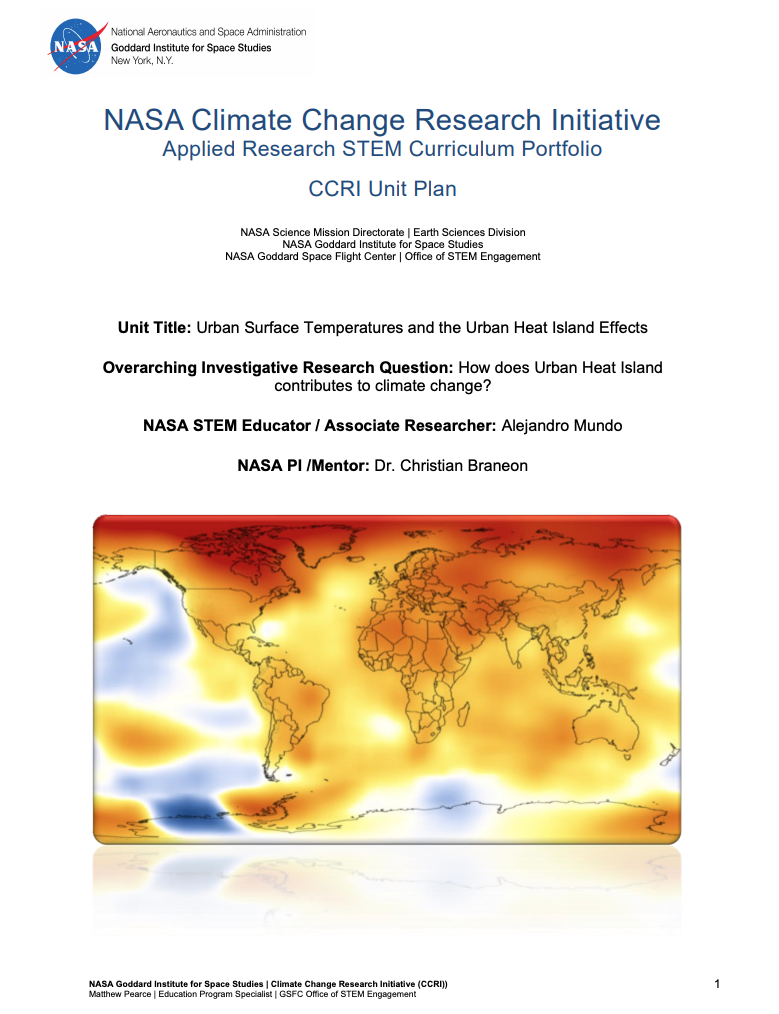
This unit plan is published by the NASA Climate Change Research Initiative's (CCRI) Applied Research STEM Curriculum Portfolio. The CCRI Unit Plan, called “Urban Surface Temperatures and the Urban Heat Island Effects,“ has the purpose to educate students how climate is changi
Grade Level: 6-8
The Urban Heat Island Implementation Sequence provides a series of lessons and activities for students to learn about the processes that create differences in surface temperatures, as well as how human activities have led to the creation of urban heat islands.
Urban Heat Islands landing page. Explore maps, graphs, data, and related education resources. These resources include lesson plans, mini lessons, activities, and datasets for teachers and students.