Grade Level: 3-5
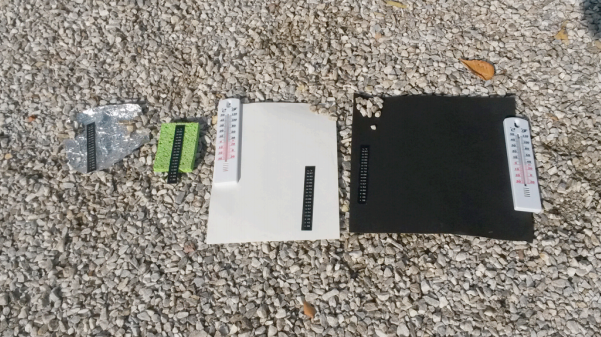
In this activity, students explore the Urban Heat Island Effect phenomenon by collecting temperatures of different materials with respect to their locations.
An urban heat island is a phenomenon that is best described when a city experiences much warmer temperatures than in nearby rural areas. The sun’s heat and light reach the city and the country in the same way. The difference in temperature between urban and less-developed rural areas has to do with how well the surfaces in each environment absorb and hold heat.


In this activity, students explore the Urban Heat Island Effect phenomenon by collecting temperatures of different materials with respect to their locations.
To investigate the different rates of heating and cooling of certain materials on earth in order to understand the heating dynamics that take place in the Earth’s atmosphere.
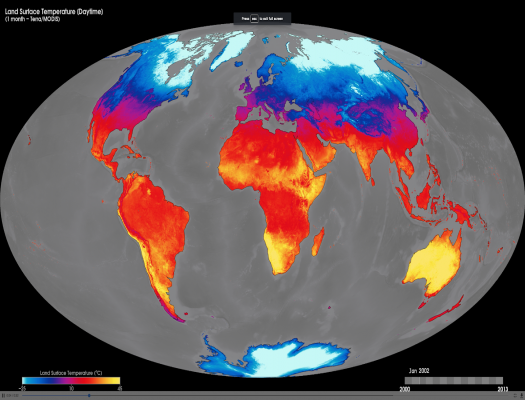

Examine (daytime) surface temperature and solar radiation received at locations found near similar latitudes using NASA Data.

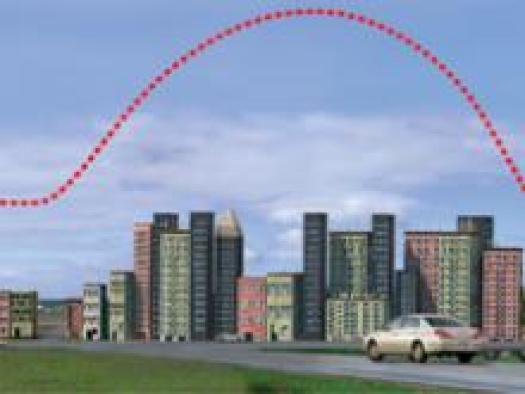
Students will analyze and interpret graphs to compare the flow of (shortwave) energy from the Sun toward China over the course of a year on cloudy versus clear days. Students will draw a conclusion and support it with evidence.

Students will analyze and interpret maps of the average net atmospheric radiation to compare the flow of energy from the Sun toward Earth in different months and for cloudy versus clear days. Students will draw conclusions and support them with evidence.
In this activity, students explore the Urban Heat Island Effect phenomenon by collecting temperatures of different materials with respect to their locations.

To investigate the different rates of heating and cooling of certain materials on earth in order to understand the heating dynamics that take place in the Earth’s atmosphere.

Examine (daytime) surface temperature and solar radiation received at locations found near similar latitudes using NASA Data.
Students will analyze and interpret graphs to compare the flow of (shortwave) energy from the Sun toward China over the course of a year on cloudy versus clear days. Students will draw a conclusion and support it with evidence.

Students will analyze and interpret maps of the average net atmospheric radiation to compare the flow of energy from the Sun toward Earth in different months and for cloudy versus clear days. Students will draw conclusions and support them with evidence.