Grade Level: 6-8,
9-12
This StoryMap allows students to explore the urban heat island effect using land surface temperature and vegetation data in a 5 E-learning cycle.
An urban heat island is a phenomenon that is best described when a city experiences much warmer temperatures than in nearby rural areas. The sun’s heat and light reach the city and the country in the same way. The difference in temperature between urban and less-developed rural areas has to do with how well the surfaces in each environment absorb and hold heat.


This StoryMap allows students to explore the urban heat island effect using land surface temperature and vegetation data in a 5 E-learning cycle.
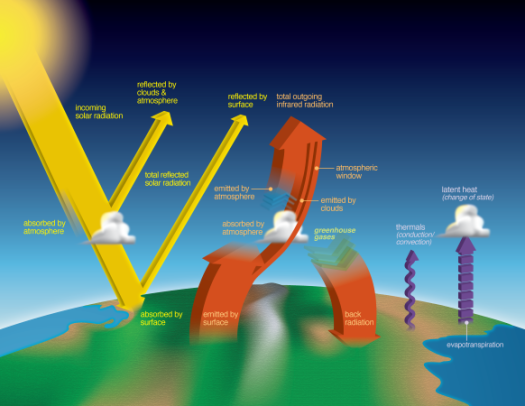
In this StoryMap students will learn about the different components of the Earth's Energy Budget, where in the Earth System energy is being absorbed and reflected, and how features of the Earth such as clouds, aerosols, and greenhouse gases, can cause variations in the flow of energy into and out
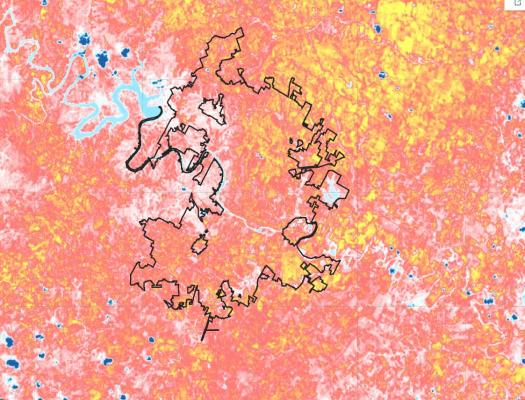
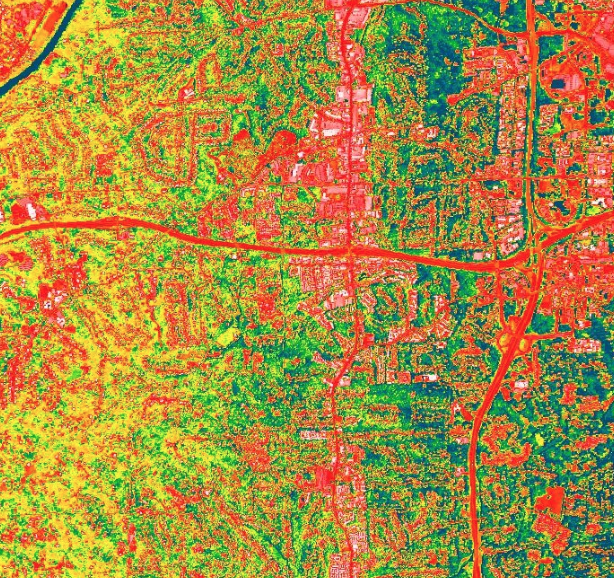
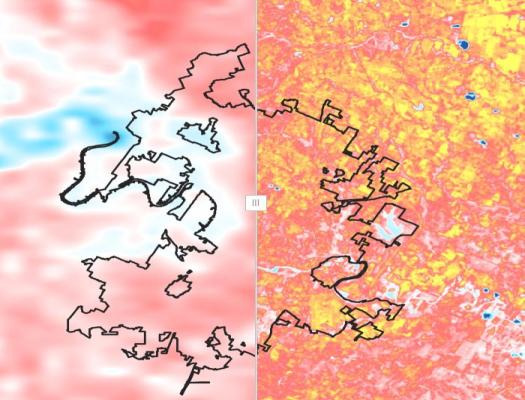
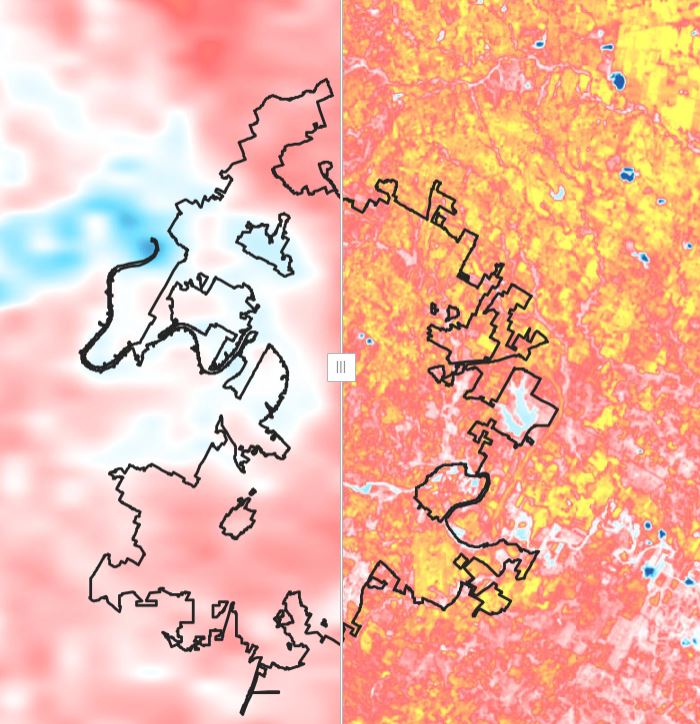
Students will analyze how surface (skin) temperatures vary across a community and determine what factors contribute to this variation. Students will describe how human activity can affect the local environment.
Students will identify and describe the relationship between land cover classification and surface temperature as they relate to the urban heat island effect. Students will also describe patterns between population density and the locations of urban heat islands.
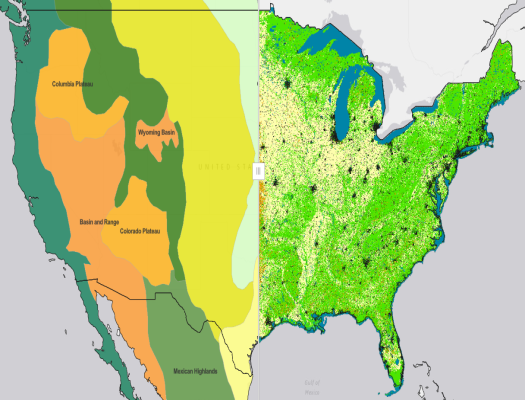
After learning about the different characteristics of satellite data, students will describe the advantages and disadvantages of using two different satellites to study the Urban Heat Island Effect.
This StoryMap allows students to explore the urban heat island effect using land surface temperature and vegetation data in a 5 E-learning cycle.

In this StoryMap students will learn about the different components of the Earth's Energy Budget, where in the Earth System energy is being absorbed and reflected, and how features of the Earth such as clouds, aerosols, and greenhouse gases, can cause variations in the flow of energy into and out

Students will analyze how surface (skin) temperatures vary across a community and determine what factors contribute to this variation. Students will describe how human activity can affect the local environment.

Students will identify and describe the relationship between land cover classification and surface temperature as they relate to the urban heat island effect. Students will also describe patterns between population density and the locations of urban heat islands.
After learning about the different characteristics of satellite data, students will describe the advantages and disadvantages of using two different satellites to study the Urban Heat Island Effect.