Lesson Plans
Heat Domes and Ozone Pollution
Overview
Several heat domes have occurred over the last few summers and around the world. This lesson provides one example from 2021 in Portland, Oregon, with temperature and ozone data. After an explanation/review of ozone with a variety of models and video clips, students are asked questions based on the graphs of the data.
Materials Required
Choose one of the following for students to use.
Procedure
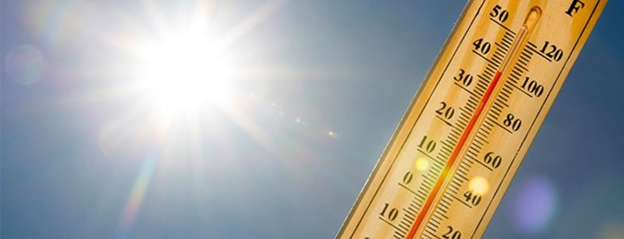
This lesson focuses on a heat dome in Portland, Oregon in 2021. Since this data is only a snapshot, students are not expected to analyze it in detail, however there is enough evidence to prompt students to consider the potential relationship between temperature and ozone pollution. After an explanation/review of ozone with a variety of models and video clips, students are asked questions based on the graphs of the data.
Consider using any of the short video clips provided about ozone as a hook or activating prior knowledge for students:
- NASA eClips: Spotlites Ozone. Source: NASA eClipse. (https://www.youtube.com/watch?v=maLRzINR4UY)
- Ground Level Ozone: What Is It? Source: NCAR & UCAR Education and Outreach. (https://www.youtube.com/watch?v=THYoUULn_2U&t=4s)
- Why Is Ozone Dangerous? Source: NCAR & UCAR Education and Outreach. (https://www.youtube.com/watch?v=LQgYniOiyY4)
Note: If students are accessing the Google Slides version, it is recommended that the two graphs be displayed together on a large screen for easier comparison. Student answers to questions will vary.
Steps
- Lead students through the content. If appropriate, they can use the slide show to work independently.
- After each section, students should answer the question set before continuing.
- Lead a class discussion about their final claim/proposal and the evidence needed to prove it.
Why study heat domes and their effects?
Heat and air pollution might be two of the biggest threats to our planet as the climate changes. The term “heat dome” is heard in the summer, when unusually high temperatures occur. A significant event can last a few days, or a few weeks. The biggest challenges come when a heat dome occurs in a location where exceptionally high temperatures is an unusual weather pattern. Temperature records may be broken. The effects on living things and infrastructure can be severe.
Heat Dome and Ozone Pollution
Heat and air pollution might be two of the biggest threats to our planet as the climate changes. The term “heat dome” is heard in the summer, when unusually high temperatures occur. The event can last a few days, or a few weeks. The biggest challenges come when a heat dome occurs in a location not used to this weather pattern. Temperature records may be broken. The effects on living things and infrastructure can be severe.
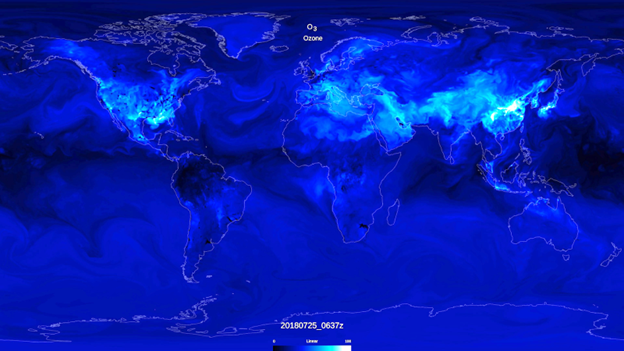
Warm, sunny skies increase the concentration of ozone over cities. A heat dome occurs when the atmosphere traps hot ocean air like a lid or cap. Heat domes create especially hazardous conditions when pollution levels are harmful.
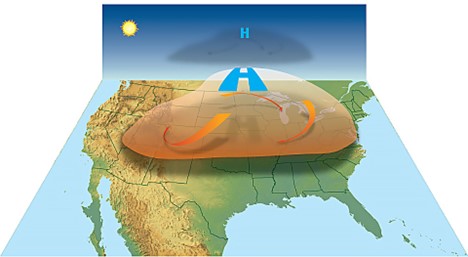
GOES satellite data and ground-level sensors were used to create models showing the extent of a June 2021 heat dome, with effects as far north as Alaska.
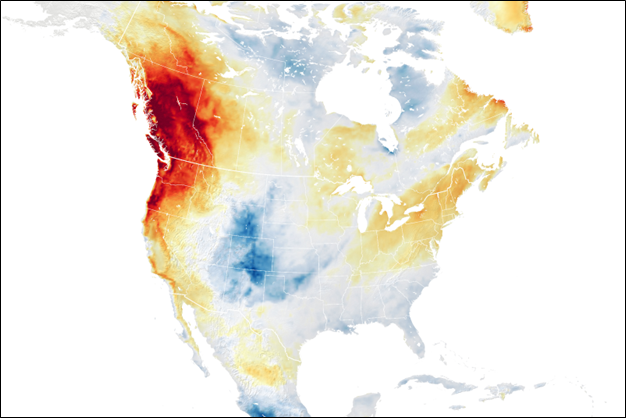
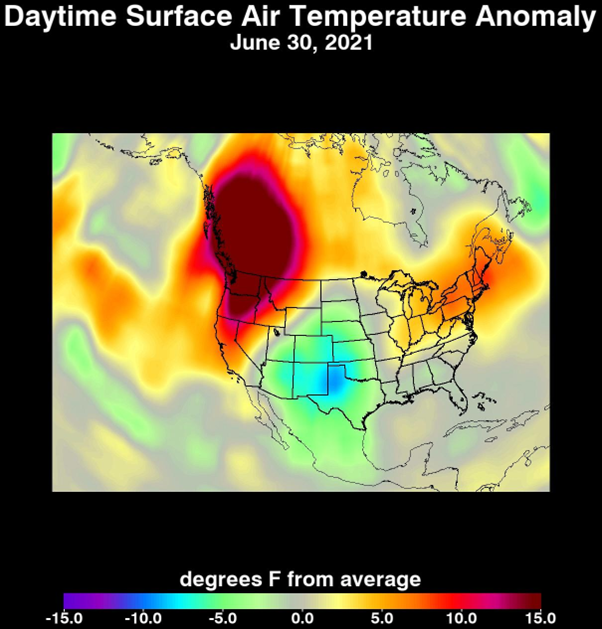
The heat dome occurred over the Pacific Northwest and British Columbia in June 2021. Temperatures in some locations were more than 15 degrees Fahrenheit above normal, for nine days. While the heat was intense in one location, below-normal temperatures occurred elsewhere, like Texas. To see how the heat dome progressed, you can view Heat Wave Surface Temperature for the visualization.
Question Set 1
- Which states were most affected by the heat dome?
- What other area, even larger, was most affected by the heat dome?
- Describe something you know about these areas that made this heat dome particularly devastating.
Stratospheric and Tropospheric Ozone
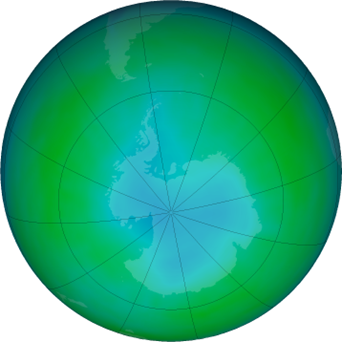
Stratospheric ozone is in the layer of the atmosphere called the stratosphere and is often called the ozone layer. Tropospheric ozone is in the lowest layer of Earth's atmosphere, the troposphere. The image shows a false-color view of total ozone over the Antarctic pole. The purple and blue colors are where there is the least ozone, and the yellows and reds are where there is more ozone. https://ozonewatch.gsfc.nasa.gov/
(https://mynasadata.larc.nasa.gov/sites/default/files/inline-images/Ozone%20Antarctic.png)
Question Set 2
- What is the difference between stratospheric and surface ozone?
How Does Ozone Form
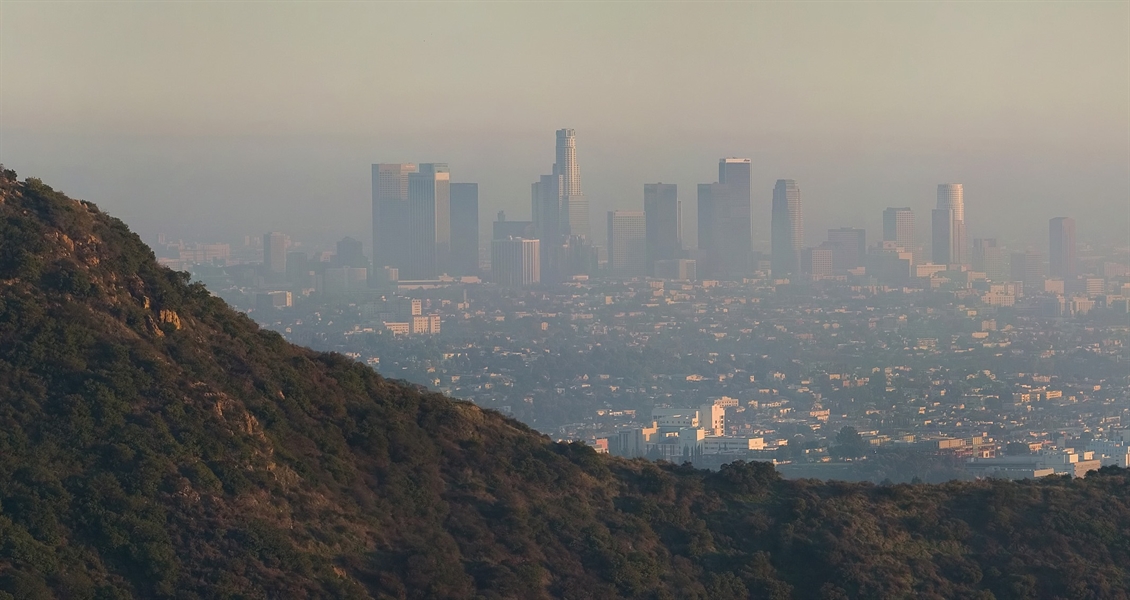
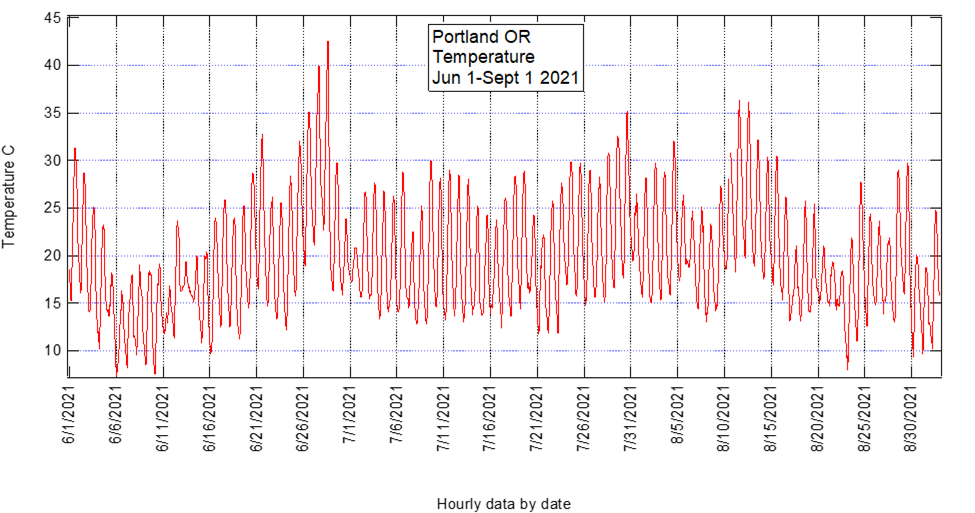
Surface ozone forms when the necessary ingredient pollutants are present, often from sources such as vehicles. With more vehicles in a large city, there is more potential for ozone to form during warm, sunny days. Is there evidence for an increase in ozone during the heat dome in the Pacific Northwest in 2021? Compare the temperature and ozone data from Portland, Oregon. They are in the slides or the PDF document.
Question Set 3
- What, if any, similarities in the data do you see between the two graphs?
- Identify the highest values on both graphs. Are these data points on the same date?
- Are the dates during the Pacific Northwest heat dome?
- Is this enough data to prove that the high ozone readings were caused by the excessively high temperatures? Why or why not?
- While this may or may not be enough evidence to conclusively know if there is a connection between temperature and ozone, what would make this evidence stronger?
- Look at the data for July 28-29. The ozone readings are high, but the temperatures are not as high as in June. Propose an explanation for why the ozone readings could still be high even when the temperatures aren’t.
- What evidence would you need to prove your explanation?
Answers:
Teachers who are interested in receiving the answer key, please complete the Teacher Key Request and Verification Form. We verify that requestors are teachers prior to sending access to the answer keys as we’ve had many students try to pass as teachers to gain access.
Sources:
- NASA eClips: Spotlites Ozone. (2017, October 6). YouTube. Retrieved September 27, 2022, from https://www.youtube.com/watch?v=maLRzINR4UY
- Ground Level Ozone: What Is It? (2014, July 14). YouTube. Retrieved September 27, 2022, from https://www.youtube.com/watch?v=THYoUULn_2U&t=4s
- Why Is Ozone Dangerous? (2021, January 26). YouTube. Retrieved September 27, 2022, from https://www.youtube.com/watch?v=LQgYniOiyY4
- What is a heat dome? (2021, July 7). National Ocean Service. Retrieved September 27, 2022, from https://oceanservice.noaa.gov/facts/heat-dome.html
- Hansen, K. (2021, June 28). Exceptional Heat Hits Pacific Northwest. NASA Earth Observatory. Retrieved September 27, 2022, from https://earthobservatory.nasa.gov/images/148506/exceptional-heat-hits-p…
- Heat Wave Surface Temperature. (2021, July 8). Jet Propulsion Laboratory. Retrieved September 27, 2022, from https://www.jpl.nasa.gov/images/pia24537-heat-wave-surface-temperature
- Increasing 'Bad' Ozone Threatens Human and Plant Health. (2010, May 8). NASA. Retrieved September 27, 2022, from https://www.nasa.gov/topics/earth/features/bad_ozone.html
- NASA. (n.d.). NASA Ozone Watch: Latest status of ozone. Retrieved October 3, 2022, from https://ozonewatch.gsfc.nasa.gov/
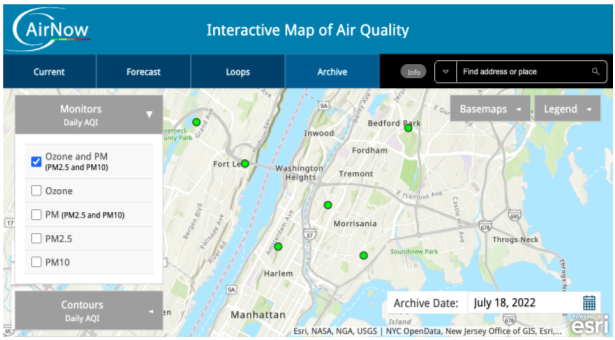
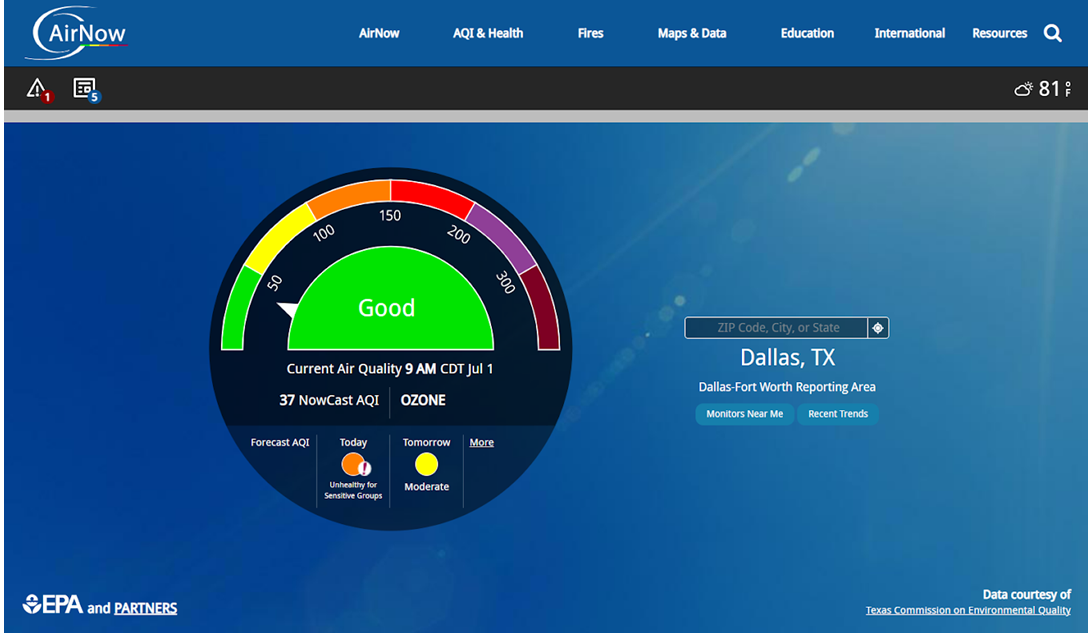
- (n.d.). AirNow.gov. Retrieved October 3, 2022, from https://www.airnow.gov/
Disciplinary Core Ideas:
- ESS3C: Human Impacts on Earth Systems
Crosscutting Concepts:
- Patterns
- Cause and Effect
Science and Engineering Practices:
- Developing and Using Models
- Analyzing and Interpreting Data
Students will use graphs to look for evidence of a connection between high air temperatures and high levels of ozone.
Are high ozone values a result of high air temperatures?
- Ozone is always harmful.
- Ozone forms only with high temperatures.
- Ozone on the surface is the same as ozone in the stratosphere.
- Internet Required
- One-to-One (tablet, laptop, or CPU)
- One-to-a-Group

