Scale, Proportion, and Quantity

Scale, Proportion, and Quantity
NASA enables scientists around the world to understand how the universe works by collecting data of events or objects and making those data accessible. In fact, NASA has over 26 petabytes of Earth data sets that are available to scientists– that's 26 million gigabytes, or enough data to need 52,000 computers each with 500 gigabytes of storage space. Earth scientists use these data to understand how the Earth system works and how the spheres within the Earth system interact with one another.
The Earth's system is characterized by the interaction of processes that take place on molecular (very small) and planetary (very large) spatial scales, as well as on short and long time scales. Before scientists may begin their work with these data, it is important that they understand what the data are. As we attempt to understand how these complex systems and phenomena behave and interact, we must think in terms of time span (e.g., seconds, days, centuries, epochs, etc.), size (e.g., electrons, water bodies, planets, etc.), and energy flowing within the systems/phenomena (e.g., photons, batteries, solar energy). To try to make sense of all of these data, scientists view the data from three different contexts: Scale, Quantity, and Proportion.
Scale is a magnitude or range value that describes an event or object that is measurable. Scale can also refer to the magnitude/range of an object (of one whole) in relation to another object (within another whole). Note: Phenomena can be observed at various scales using models to study systems that are too large or too small. Phenomena that can be observed at one scale may not be observable at another scale.
Three common types of scales used in Earth System Science include:
- Logarithmic scales such as Richter, pH
- Ordinal scales such as the Saffir-Simpson Hurricane Scale and the Enhanced Fujita Scale
- Interval scales such as Kelvin, Fahrenheit, and Celsius
Quantity describes the amount or number of an object or event in particular units. These units give the context of the values. Standard units are used to measure and describe physical quantities such as weight, time, temperature and volume.
Proportion is the relationship between parts to each other or to a whole. Proportional relationships (e.g. speed as the ratio of distance traveled to time taken) among different types of quantities provide information about the magnitude of properties and processes.
The NGSS Crosscutting Concept of Scale, Quantity, and Proportion is summarized as follows at NASA SpacePlace:
- Observable phenomena exist from very short to very long time periods.
- Natural objects exist from the very small to the immensely large.
- Standard units are used to measure and describe physical quantities such as weight, time, temperature, and volume.
- Time, space, and energy phenomena can be observed at various scales using models to study systems that are too large or too small.
- Proportional relationships (e.g. speed as the ratio of distance traveled to time taken) among different types of quantities provide information about the magnitude of properties and processes.
- Phenomena that can be observed at one scale may not be observable at another scale.
Source: NASA SpacePlace
My NASA Data Support of Standard Units and Proportions
The Data Collections in the My NASA Data Earth System Data Explorer use a variety of different units. When the data are accessed there is a detailed description of the unit used for each and how it relates to the data. This is very useful for students and highlights that there are different units for different data. An example of this for Chlorophyll Concentration is shown below.
There are also two mini lessons in My NASA Data that highlight proportions for Leaf Area Index and Normalized Difference Vegetation Index. These mini lessons both explore the magnitude of the proportion and explain whey they are dimensionless.
- Leaf Area Index - Using Units in Calculations
- Normalized Difference Vegetation Index - Using Units in Calculations
My NASA Data Support of Scale
There are a variety of resources that look at data on different scales. This includes various time scales as well as using the vantage point of space to study large scale events such as land use change and sea ice change. NASA can also study small microscopic particles in the atmosphere or look for large scale effects of microscopic organisms in the ocean.
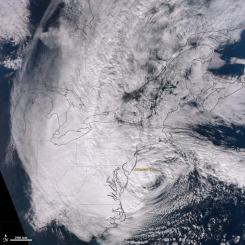
The following lesson guides students through modeling the scale of a large storm and comparing it with the size of the United States.
Examples of Driving Questions for Scale, Quantity, and Proportion:
- What characteristics does this Earth System phenomenon have at the nano, micro, or macro scales?
- What effects does this phenomenon have on other spheres within the Earth system at global scales?
- How do scientists observe a change of this phenomenon at nano, micro, or macro scales?
- What units are used to describe the quantities of variables at these different scales?
- How has the frequency of this phenomenon changed over time?
- What units should I use to measure __________?
- How does the amount of ________ compare the amount of __________?
- What should we measure to figure out the relationship?


