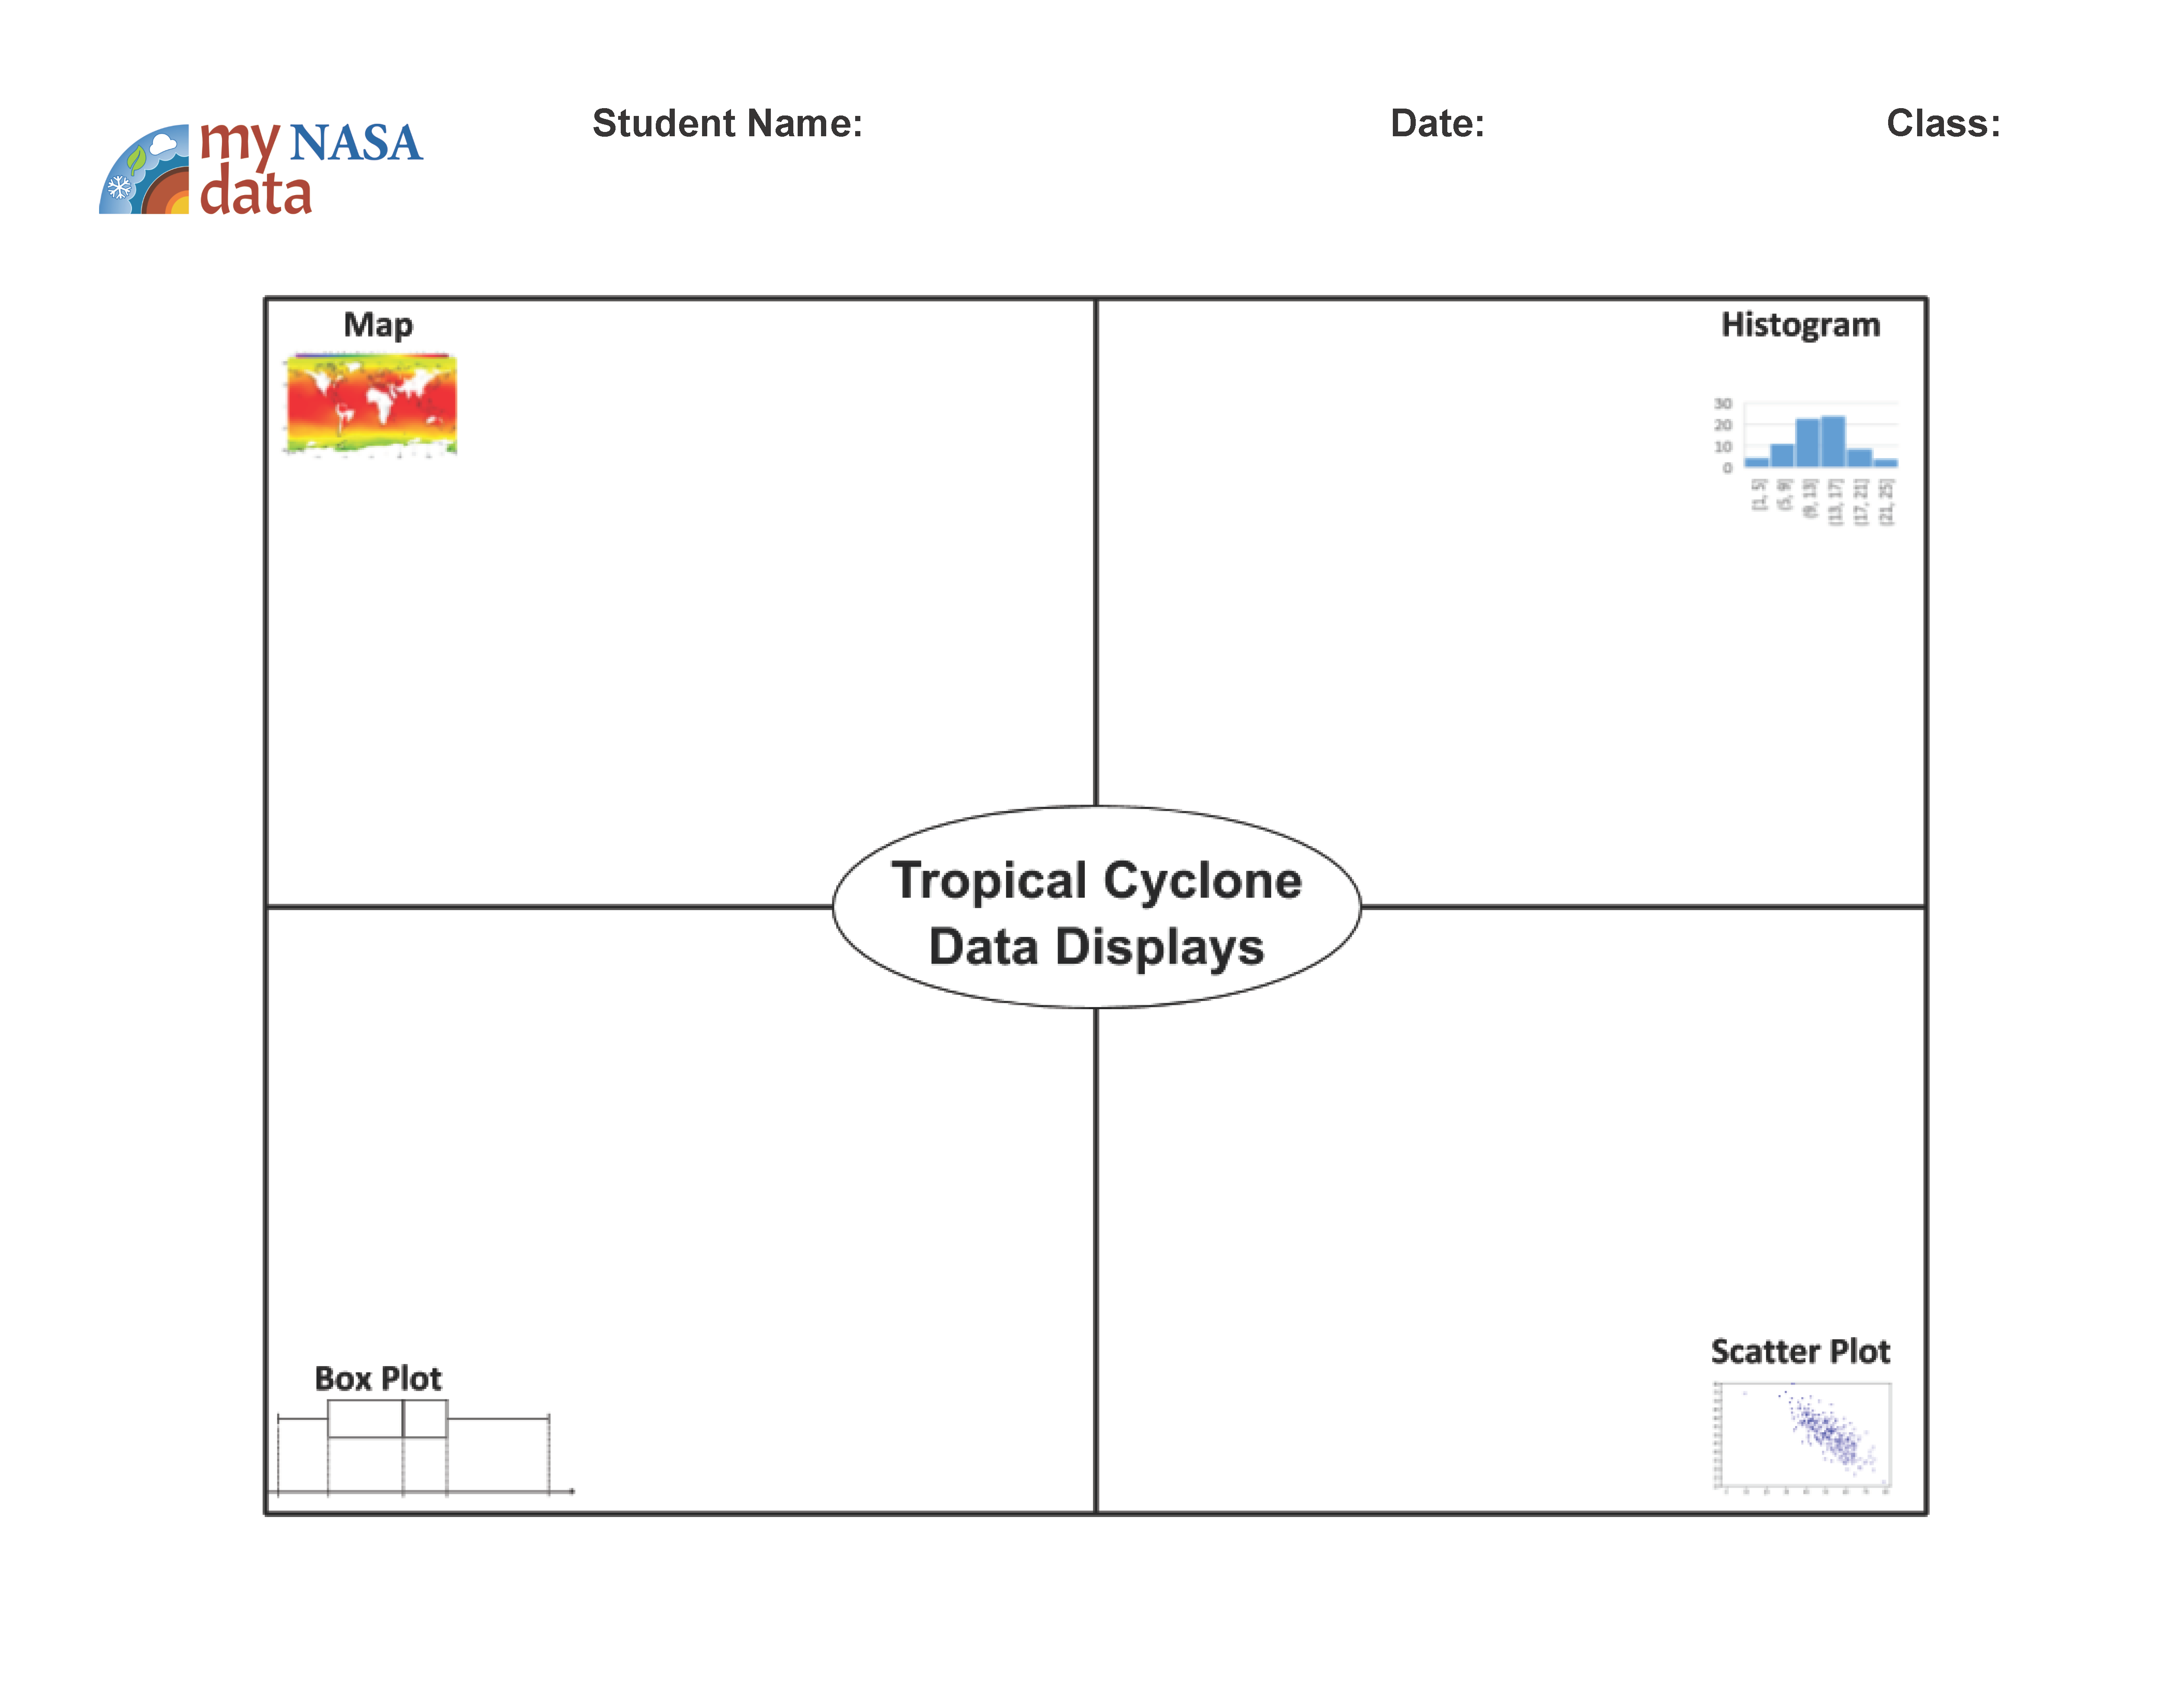
The purpose of this lesson is for students to compare data displays to determine which best answers the driving question. To do this they will evaluate the spread of the data and what the displays show.
loading Atmosphere...
Featured Lesson Plans
GLOBE Earth System Poster Activity Guide
The processes comprising the Earth’s environment are interconnected. Understanding how these connections operate on a global scale is to understand the Earth as a system.
Introduction: Building Claims from Evidence
Students will practice the process of making claims, collecting evidence to support claims, and applying scientific reasoning to connect evidence to claims.
Seasonal Science: Building Claims from Evidence
Students will analyze surface temperature and solar radiation data to construct explanations about the relationship of seasons and temperature to the amount of solar energy received on Earth’s surface.
Comparing Temperature & Solar Radiation for Common Latitudes
Examine (daytime) surface temperature and solar radiation received at locations found near similar latitudes using NASA Data.
Earth’s Energy Budget-Seasonal Cycles
Students move through a series of short activities to explore and evaluate global solar radiation data from NASA satellites. In this process, students make qualitative and quantitative observations about seasonal variations in net energy input to the Earth System.
Inferring Relationships Among Sea Surface Salinity & Other Variables in the North Atlantic
Students will observe monthly satellite data of the North Atlantic to identify relationships among key science variables that include sea surface salinity (SS), air temperature at the ocean surface (AT), sea surface temperature (ST), evaporation (EV), precipitation (PT), and evaporation minus pre
Behavior Over Time: Analyzing Seasonal Soil and Air Properties
Students review Earth System phenomena that are affected by soil moisture. They analyze and evaluate maps of seasonal global surface air temperature and soil moisture data from NASA satellites.
When Precipitation Patterns Change: Visualizing Drought Indicators (SERC)
In this activity, students explore three indicators of drought are: soil moisture, lack of precipitation, and decreased streamflows. Students investigate each of these parameters develop a sense for the effects of drought on land.
Ocean Impacts of an El Niño Event
Students will examine a 2014-2015 El Niño Southern Oscillation (ENSO) event to identify relationships among sea surface height, sea surface temperature, precipitation, and wind vectors.
Students investigate the effects of Hurricane Sandy and make a scale model of the storm over the continental United States to assess the area of impact.