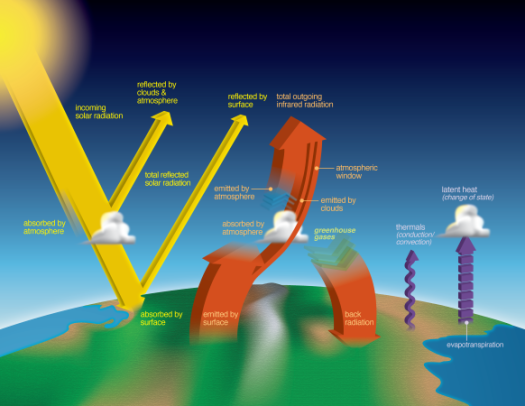
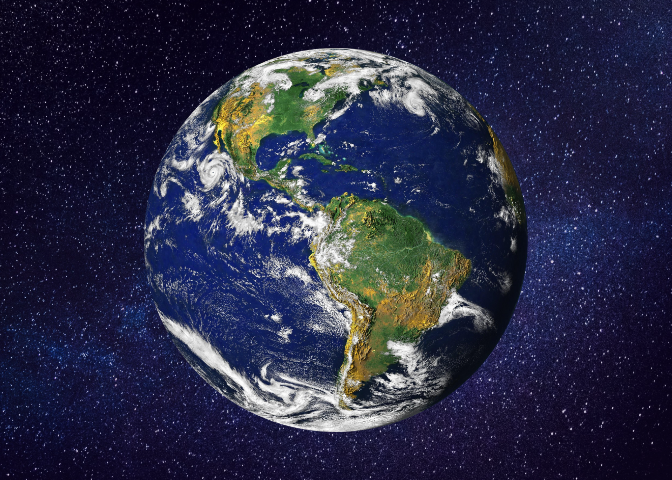
Earth strives to maintain a balance between the overall amount of incoming and outgoing energy at the top of the atmosphere. This is called Earth’s energy budget or Earth's radiation budget.
>> Read More >>
Just one moment,
loading Earth as a System...
Featured Interactives
-
-
-
-
-
-
Grade Level: 6-8, 9-12
In this StoryMap students will learn about the different components of the Earth's Energy Budget, where in the Earth System energy is being absorbed and reflected, and how features of the Earth such as clouds, aerosols, and greenhouse gases, can cause variations in the flow of energy into and out
Grade Level: 6-8, 9-12
In this interactive, students will identify the forms of energy we receive, analyze patterns in the amount of incoming solar radiation over time, and explain why some locations on Earth have greater variability in the amount of incoming solar radiation throughout a year.
Grade Level: 6-8, 9-12
In this interactive, students will observe the effects of albedo, clouds, aerosols, and greenhouse gases on Earth's Energy Budget and differentiate between the concepts of reflection and absorption.
Grade Level: 6-8, 9-12
In this interactive, students will identify and describe the different components and flows of energy of the Earth's Energy Budget diagram as well as the imbalances that exist in Earth's Energy Budget.
Grade Level: 3-5, 6-8, 9-12
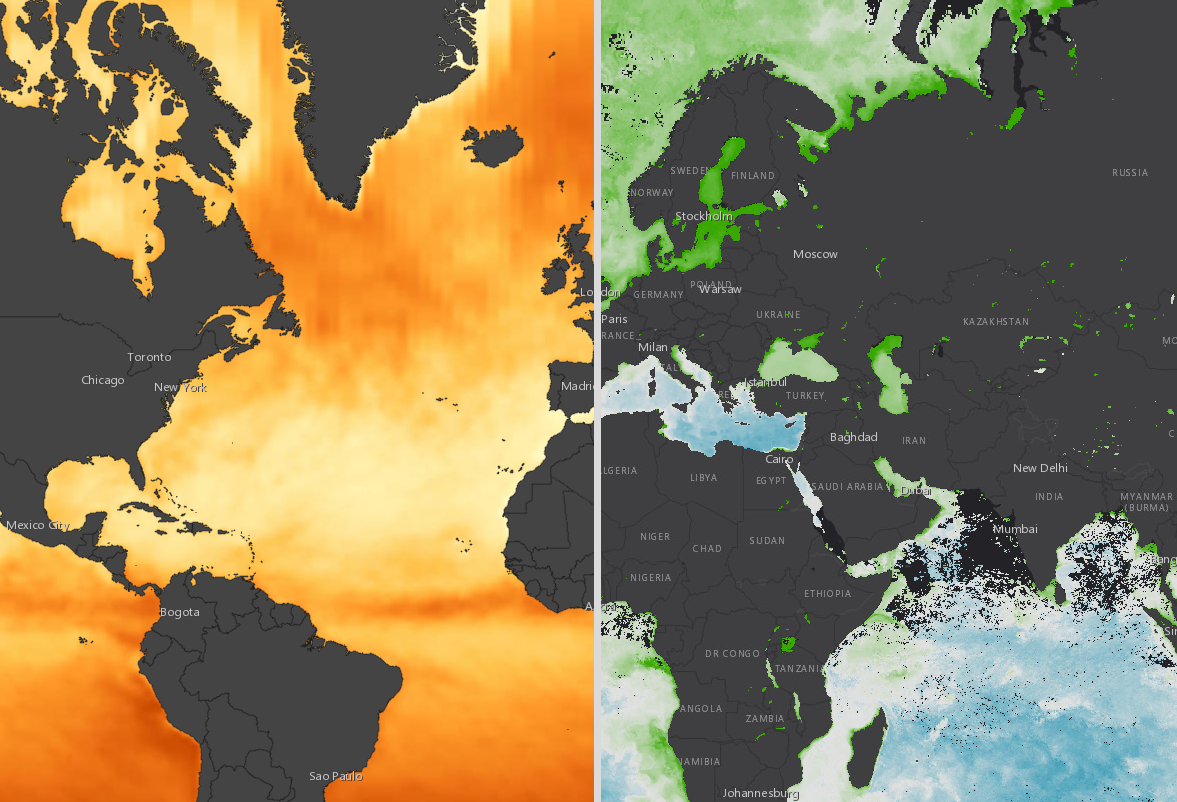
Students identify patterns and describe the relationship between chlorophyll concentration and incoming shortwave radiation.
Grade Level: 3-5, 6-8, 9-12
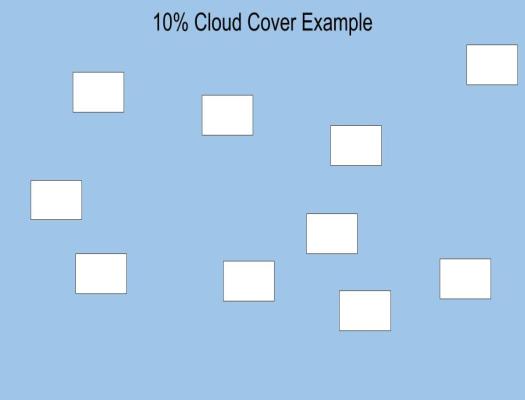
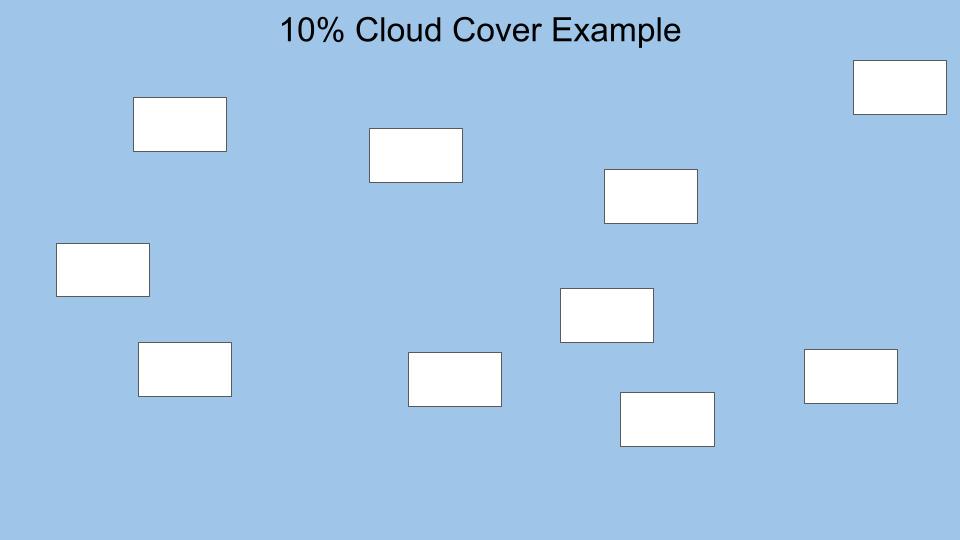
This activity will help students better understand and practice estimating percent cloud cover.
Previous
Next
Earth's Energy Budget Interactives list
Grade Level: 6-8,
9-12
In this StoryMap students will learn about the different components of the Earth's Energy Budget, where in the Earth System energy is being absorbed and reflected, and how features of the Earth such as clouds, aerosols, and greenhouse gases, can cause variations in the flow of energy into and out
Grade Level: 6-8,
9-12
In this interactive, students will identify the forms of energy we receive, analyze patterns in the amount of incoming solar radiation over time, and explain why some locations on Earth have greater variability in the amount of incoming solar radiation throughout a year.
Grade Level: 6-8,
9-12
In this interactive, students will observe the effects of albedo, clouds, aerosols, and greenhouse gases on Earth's Energy Budget and differentiate between the concepts of reflection and absorption.
Grade Level: 6-8,
9-12
In this interactive, students will identify and describe the different components and flows of energy of the Earth's Energy Budget diagram as well as the imbalances that exist in Earth's Energy Budget.
Grade Level: 3-5,
6-8,
9-12
Students identify patterns and describe the relationship between chlorophyll concentration and incoming shortwave radiation.
Grade Level: 3-5,
6-8,
9-12
This activity will help students better understand and practice estimating percent cloud cover.
Earth Energy Budget landing page. Explore maps, graphs, data, and related education resources. These resources include lesson plans, mini lessons, activities, and datasets for teachers and students.


