Interactive Models
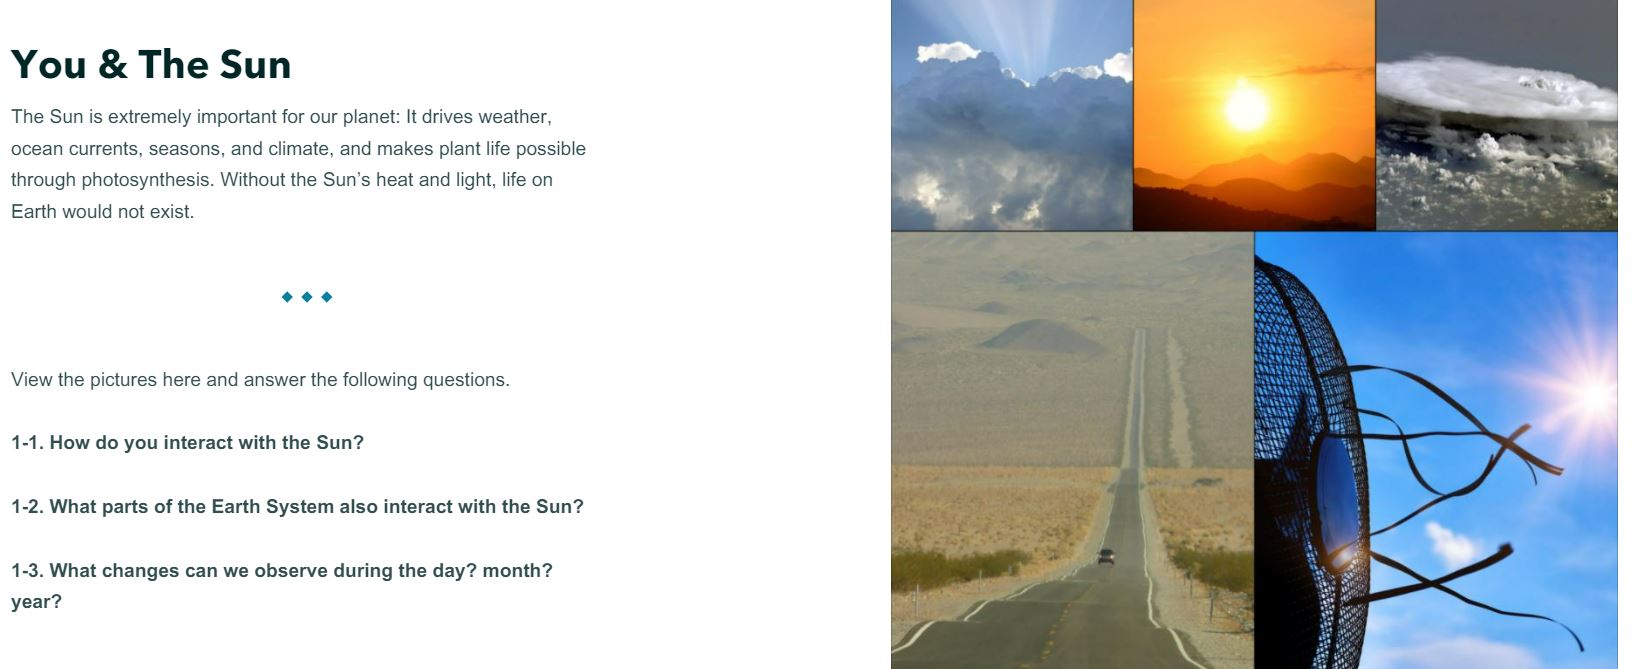
How Do We Receive Energy From the Sun?
Overview
In this interactive, students will identify the forms of energy we receive, analyze patterns in the amount of incoming solar radiation over time, and explain why some locations on Earth have greater variability in the amount of incoming solar radiation throughout a year.
This interactive model is one of a three-part sequence of learning experiences related to Earth's Energy Budget. To maximize optimal learning outcomes, it is suggested to complete the series in the following order:
- How Do We Receive Energy From the Sun? Interactive Model (current page)
- Explore Earth's Energy Budget Diagram Interactive Model
- The Role of Earth's Features in Earth's Energy Budget Interactive Model
This StoryMap is intended to be used with students who have access to a computing device in a 1:1 or 1:2 setting.
Materials Required
Resources Needed Per Student:
- Student Data Sheet or Student Data Form (Optional)
- Computer/Tablet
- Internet Access
- Link to How Do We Receive Energy From the Sun? Interactive Model
Directions
- Using an internet accessible device, students open the link to the How Do We Receive Energy From the Sun? Interactive Model to begin their exploration of this phenomenon.
- Distribute the How Do We Receive Energy From the Sun? Interactive Model Student Sheet (optional). Have students navigate on their own through the interactive model to answer the questions and complete the activities on their student sheet.
![]()
Teacher Note
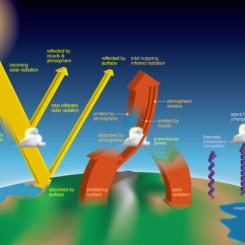
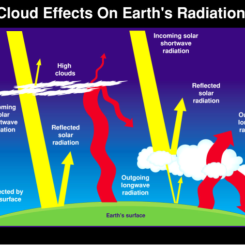
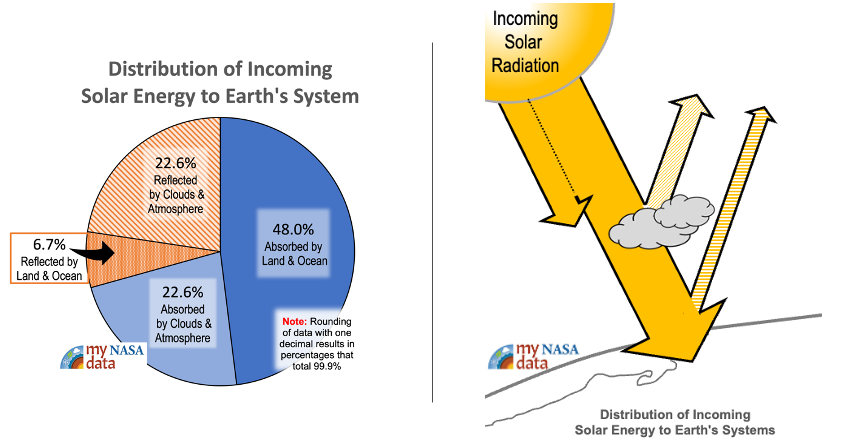
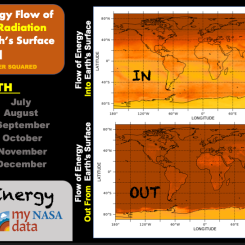
Earth strives to maintain a balance between the overall amount of incoming and outgoing energy at the top of the atmosphere. This is called Earth’s energy budget or Earth's radiation budget. Earth receives incoming energy from the Sun. Earth also emits energy back to space. For Earth’s temperature to be stable over long periods of time (for the energy budget to be in balance), the amount incoming energy and outgoing energy must be equal. If incoming energy is more than outgoing energy, Earth will warm. If outgoing energy is greater than incoming energy, Earth will cool.
To learn more, visit:
- The Earth's Energy Budget Phenomena page for background information.
Virtual Teachers: Make a copy of the ![]() Google Form of your choice so that you may assign it directly from your Google Drive into your Learning Management System (e.g., Google Classroom, Canvas, Schoology, etc.). Do you need help incorporating these Google Forms into your Learning Management System? If so, read this
Google Form of your choice so that you may assign it directly from your Google Drive into your Learning Management System (e.g., Google Classroom, Canvas, Schoology, etc.). Do you need help incorporating these Google Forms into your Learning Management System? If so, read this ![]() Guide to Using Google Forms with My NASA Data.
Guide to Using Google Forms with My NASA Data.
Teachers who are interested in receiving the answer key, please complete the Teacher Key Request and Verification Form. We verify that requestors are teachers prior to sending access to the answer keys as we’ve had many students try to pass as teachers to gain access.
Disciplinary Core Ideas:
- ESS2A: Earth Materials and Systems
- ESS3C: Human Impacts on Earth Systems
Crosscutting Concepts:
- Systems and System Models
- Stability and Change
Science and Engineering Practices:
- Developing and Using Models
- Analyzing and Interpreting Data
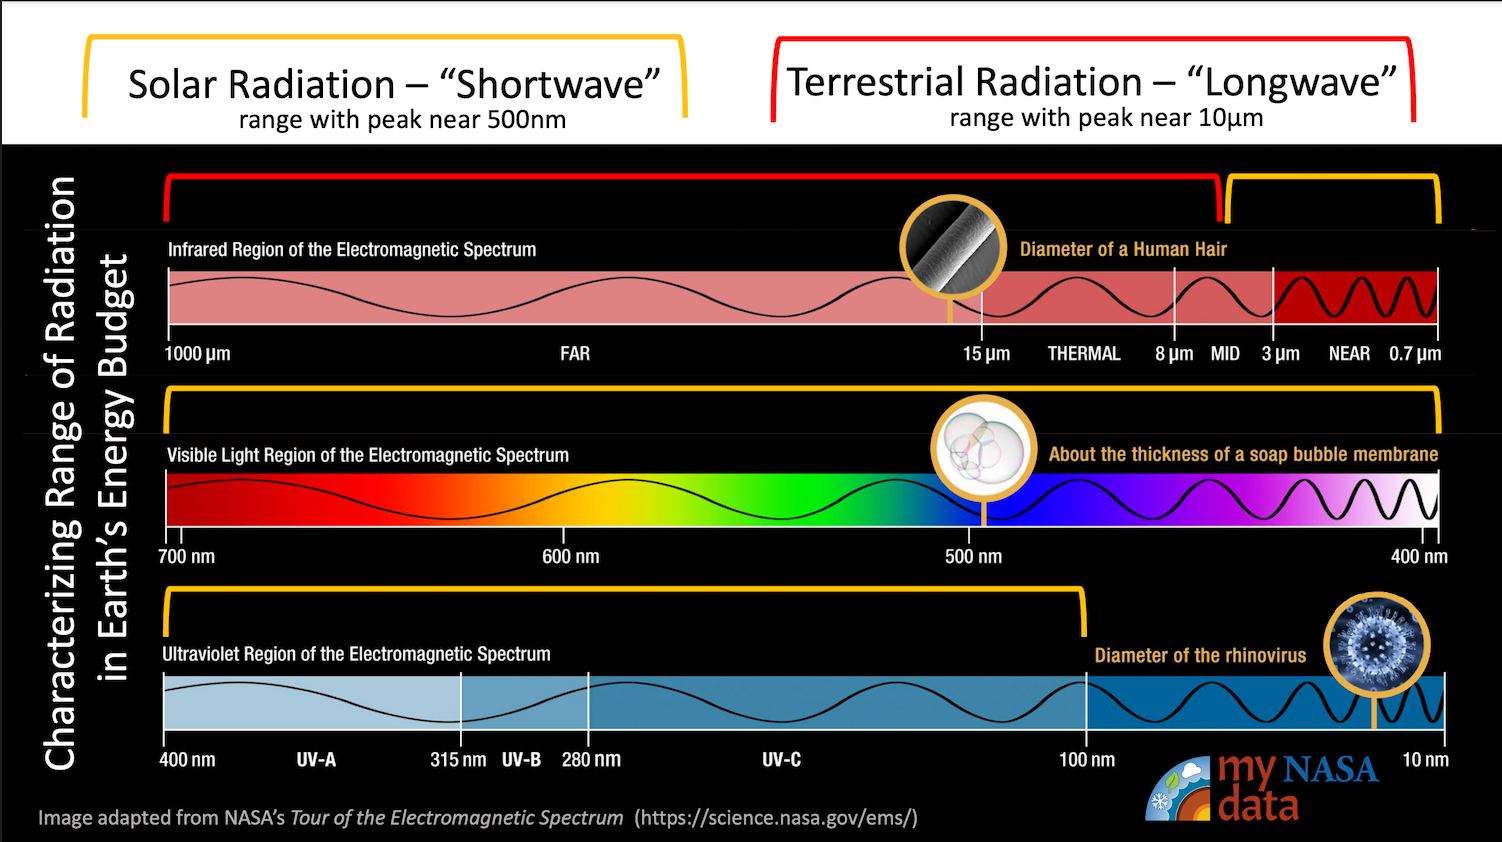
- Students will identify the forms of energy we receive from the Sun.
- Students will describe how Earth's axial tilt affects the amount of solar energy received at a location on Earth throughout the year.
- Students will analyze patterns in the amount of incoming solar radiation over time.
- Students will explain why some locations on Earth have greater variability in the amount of incoming solar radiation throughout a year.
- What patterns exist in the amount of incoming solar radiation different locations on Earth receive over time?
- Why does the amount of incoming solar radiation vary by latitude and time of year?
- How does Earth's axial tilt affect the amount of solar energy received in a location?
National Geography Standards:
- How to use maps and other geographic representations, tools, and technologies to acquire, process, and report information from a spatial perspective.
- Internet Required
- One-to-a-Group
Complementary Interactives

Complementary Mini Lessons

Grade Band
- 6-8
- 9-12
Time
- 50 minutes
Visualization Tool
NGSS Three Dimensional Learning
- See drop-down menu at the bottom of the page