Grade Level: 9-12
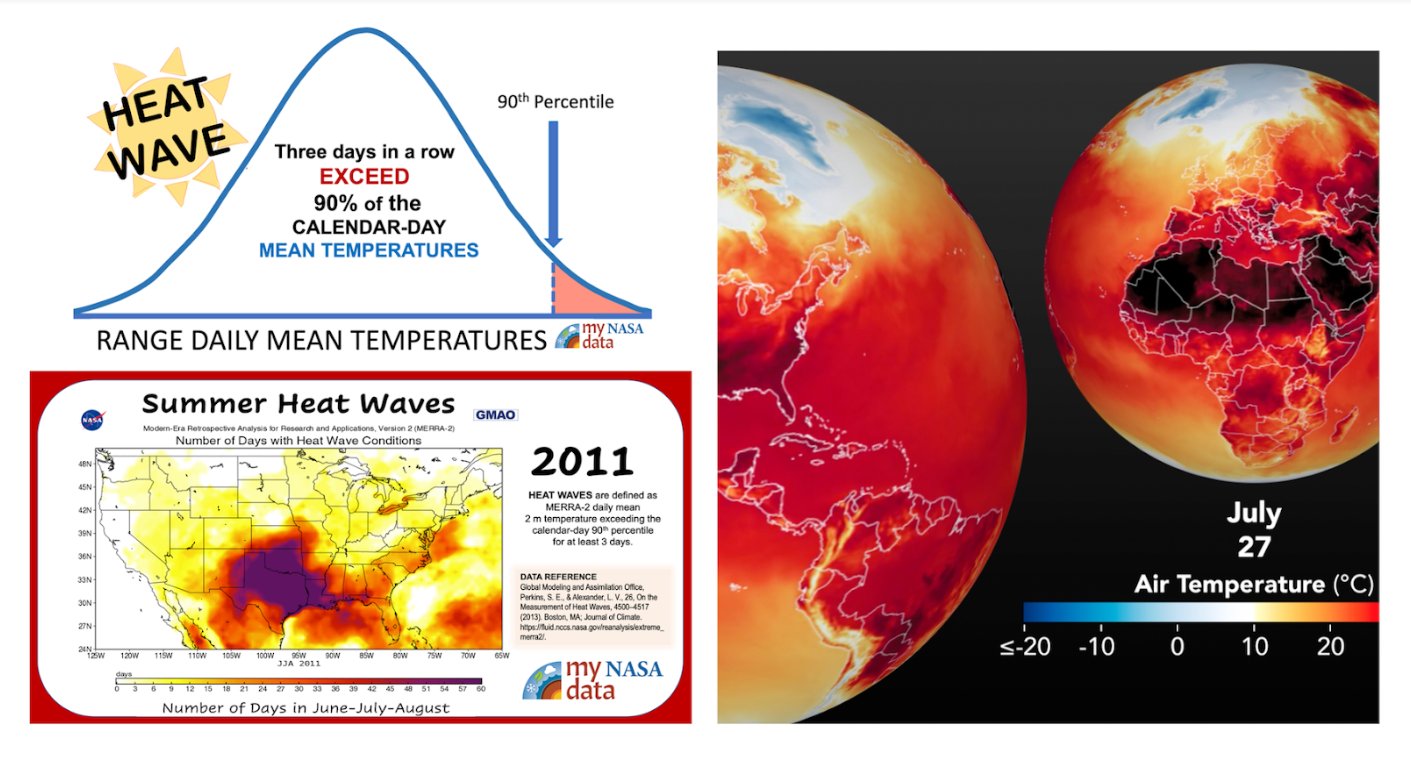
The extreme temperatures during July 2022 prompt students to investigate a model that displays historical heat wave frequency data to discover the importance of defining terms when interpreting data.
The world's surface air temperature is getting warmer. Whether the cause is human activity or natural changes in the Earth System—and the enormous body of evidence says it’s humans—thermometer readings all around the world have risen steadily since the beginning of the Industrial Revolution.


Students will analyze surface temperature and solar radiation data to construct explanations about the relationship of seasons and temperature to the amount of solar energy received on Earth’s surface. By observing graphs of these variables from three cities, students will construct claims about the seasons using scientific evidence and reasoning.

Check out the Arctic and Earth SIGNs video to explore how climate models are used in climate change research.

The activities in this guide will help students understand variations in environmental parameters by examining connections among different phenomena measured on local, regional and global scales. As students look at the connections between environmental data, they will see that the environment is the result of the interplay among many processes that take place on varying time and spatial scales.
Students move through a series of short activities to explore and evaluate global solar radiation data from NASA satellites. In this process, students make qualitative and quantitative observations about seasonal variations in net energy input to the Earth System.
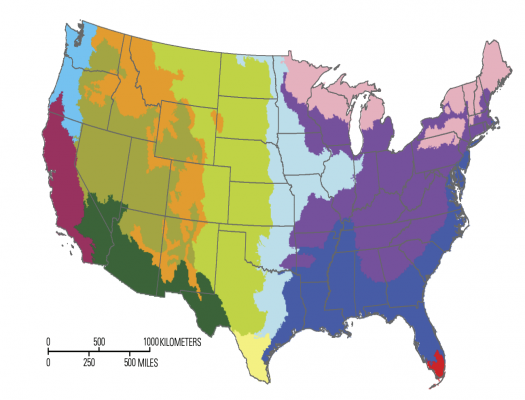

Students review Earth System phenomena that are affected by soil moisture. They analyze and evaluate maps of seasonal global surface air temperature and soil moisture data from NASA satellites. Building from their observations, students will select a location in the U.S. to extract scientific data and then create Behavior Over Time (BOT) graphs for each variable and communicate their findings.
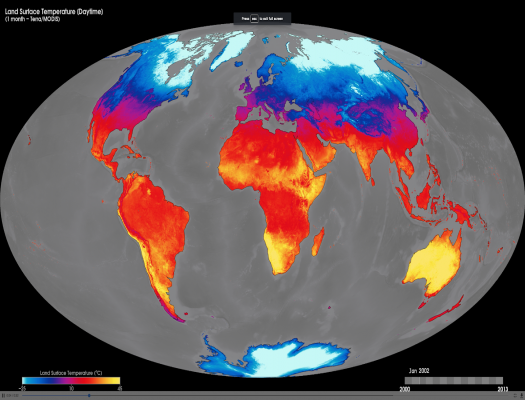
Examine (daytime) surface temperature and solar radiation received at locations found near similar latitudes using NASA Data.
NASA visualizers take data – numbers, codes – and turn them into animations people can see and quickly understand. You can become a data visualizer by creating your own flipbook animations using maps of science variables that NASA scientists commonly study to better understand the Earth System. There are six flipbooks available for different science variables: aerosols, cloud coverage, vegetation concentrations, precipitation, incoming solar radiation, and surface temperature. Each frame in the flipbooks shows monthly averages collected in 2016 and 2017.
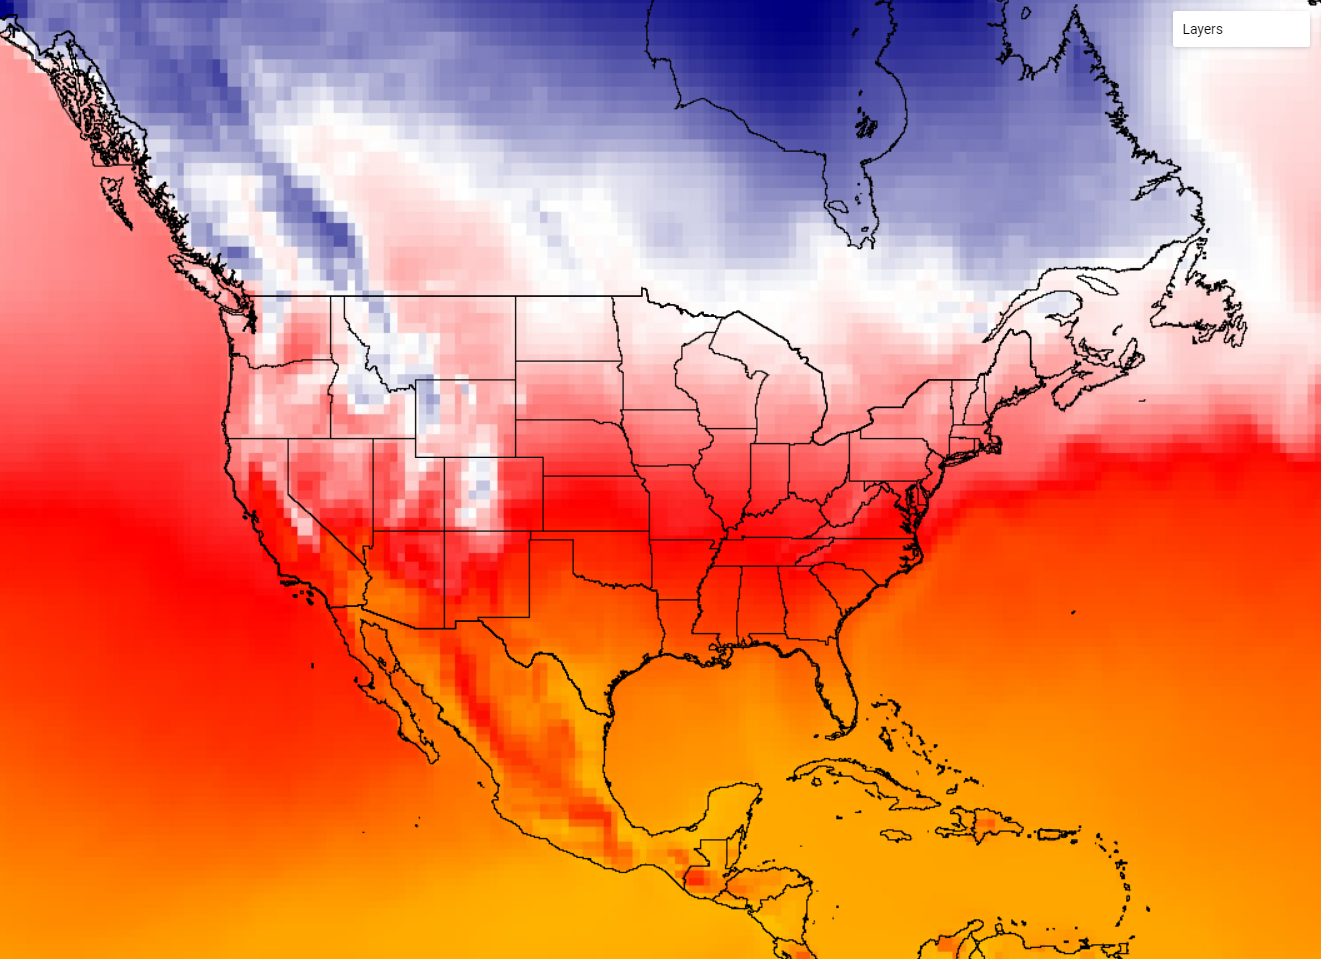
The extreme temperatures during July 2022 prompt students to investigate a model that displays historical heat wave frequency data to discover the importance of defining terms when interpreting data.

Several heat domes have occurred over the last few summers and around the world. This lesson provides one example from 2021 in Portland, Oregon, with temperature and ozone data.
The Earth System Satellite Images, along with the Data Literacy Cubes, helps the learner identify patterns in a specific image.