Mini Lesson/Activity
Relationship Between Surface Temperature and Vegetation
Overview
Students analyze Landsat images of Atlanta, Georgia to explore the relationship between surface temperature and vegetation.
Student Directions
Vegetation |
Surface Temperature |
|
Credit: U.S. Geological Survey https://www.usgs.gov/landsat-missions/landsat-normalized-difference-vegetation-index |
Credit: U.S. Geological Survey https://www.usgs.gov/landsat-missions/landsat-collection-2-surface-temperature |
Steps:
- Answer the questions below. Check with your instructor on how to submit your answers.
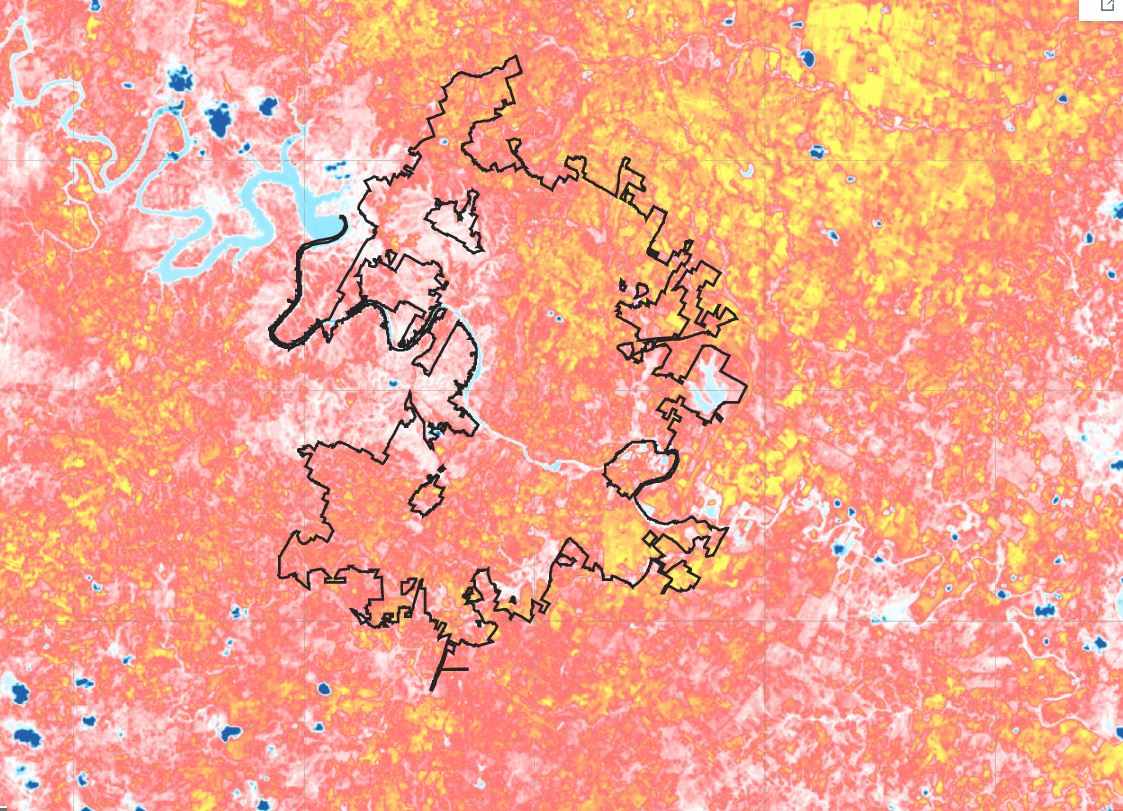
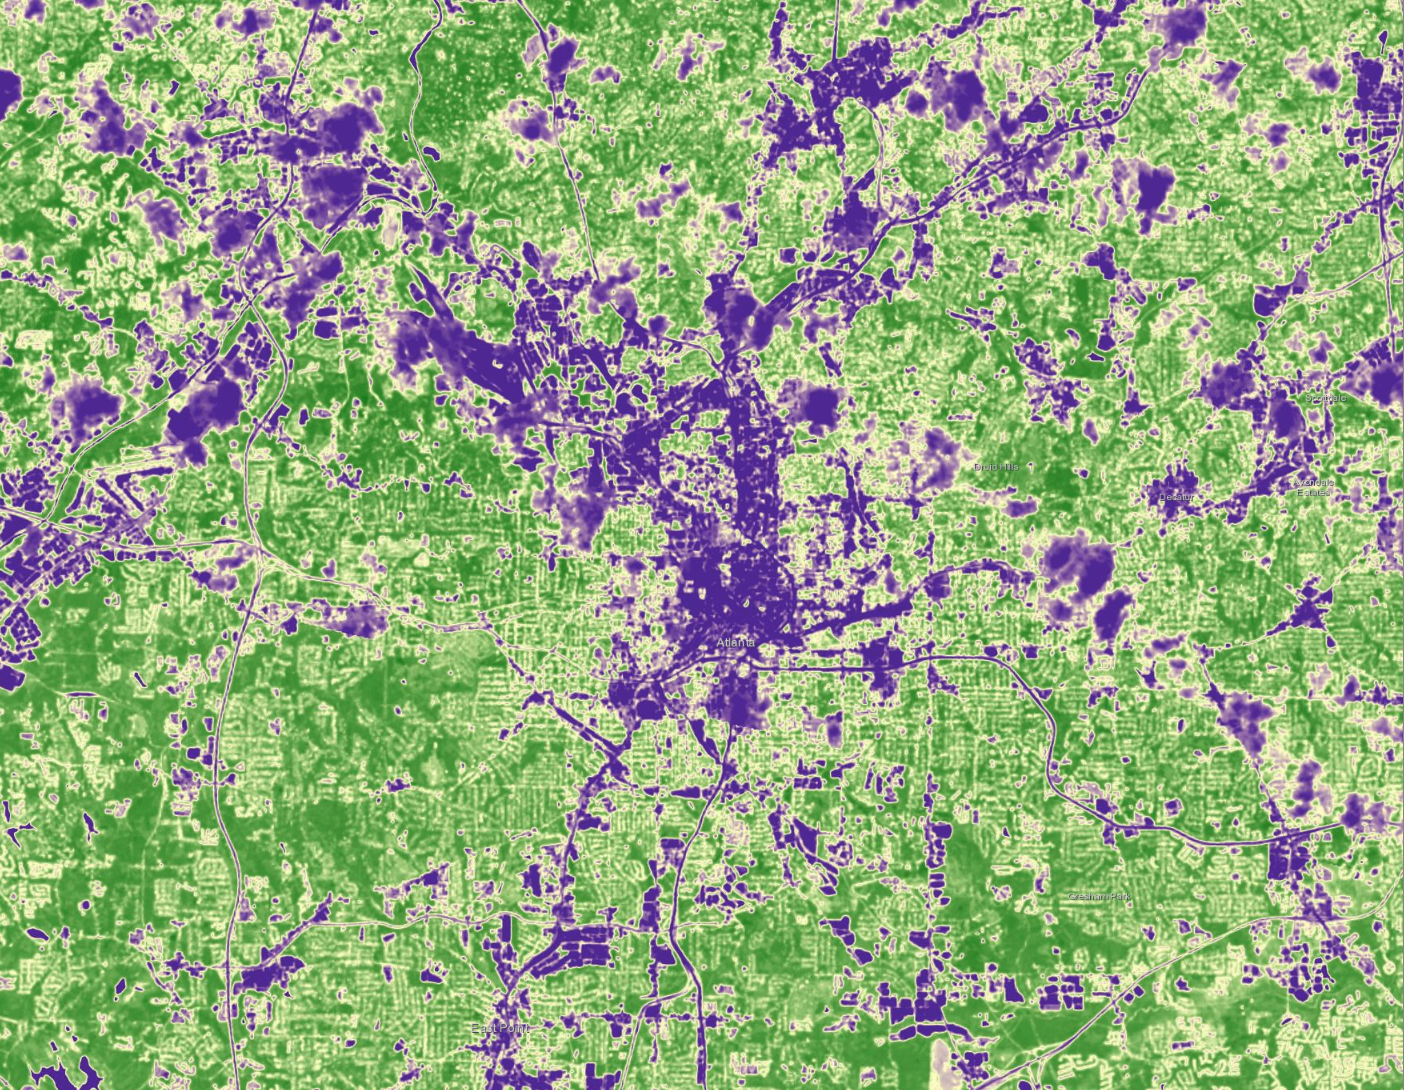
- Review the Landsat mapped image showing Vegetation of the Atlanta, Georgia region May 1, 2018. It shows Vegetation Index; it is a measure of how much near-infrared radiation is reflected at the surface and can be used to identify the locations of plants.
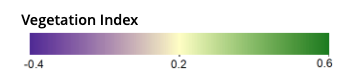
- Review the color bar below. On the legend below, areas with a vegetation index closer to 1 contain plant life, while areas less than 0 represent areas that do not contain plant life.
-
Select a quadrant to analyze in the image below and answer the questions.
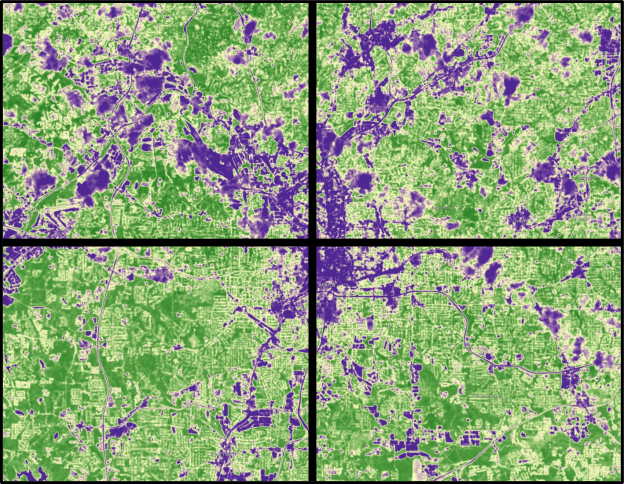
Landsat Normalized Difference Vegetation Index
Credit: U.S. Geological Survey
https://www.usgs.gov/landsat-missions/landsat-normalized-difference-vegetation-index
- Where do you find the largest and the smallest values in your quadrant.
- What kinds of environments may exist in an urban environment like Atlanta that would include areas of more/less vegetation?
- Using the vegetation map, make predictions about where you would likely find the hottest and coolest temperatures in the Atlanta metro area.
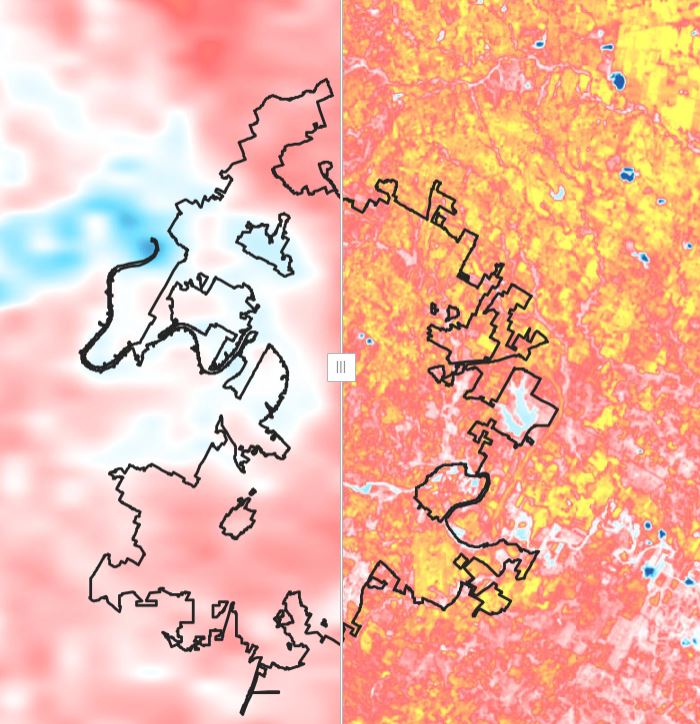
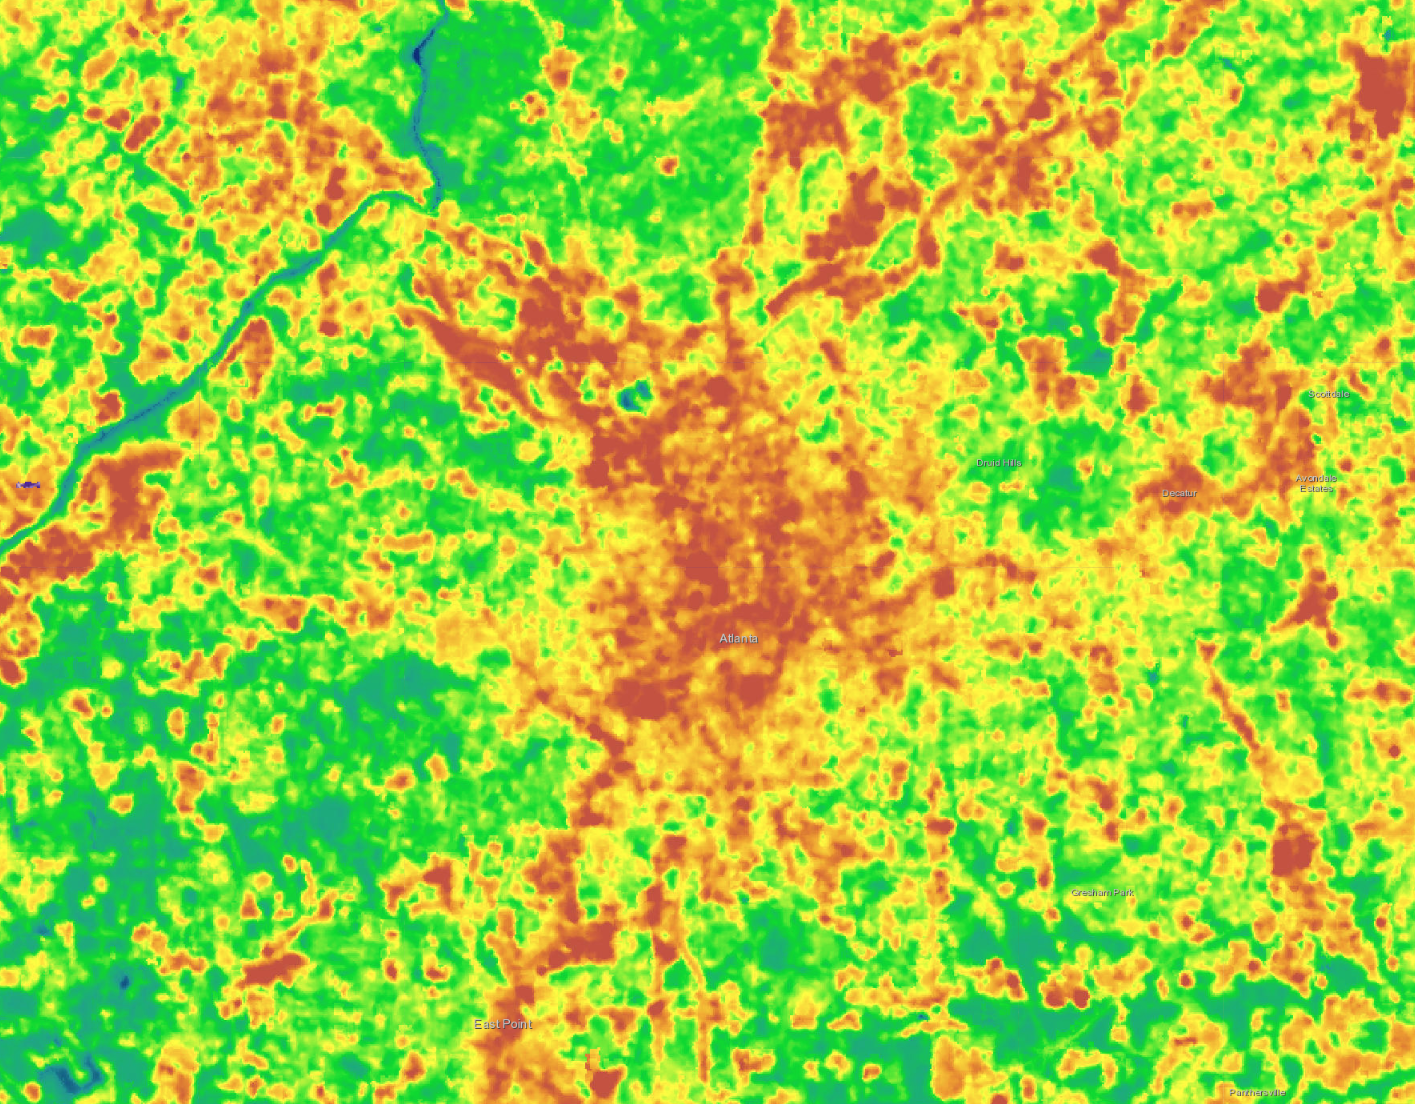
- Now observe the surface temperature image from Landsat below and
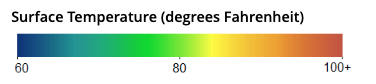 review the color bar. This image shows Surface Temperature of the Atlanta, Georgia region May 1, 2018; it represents the temperature of the Earth’s surface (expressed in degrees Fahrenheit).
 -
Now analyze the same quadrant as with the previous map.
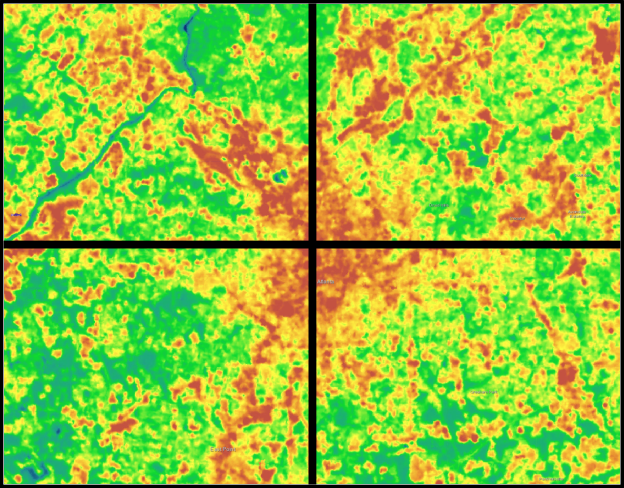
Landsat Provisional Surface Temperature
Credit: U.S. Geological Survey
https://www.usgs.gov/landsat-missions/landsat-collection-2-surface-temperature - Students answer the following questions.
- Are your predictions correct? Why or Why not?
- What patterns do you observe?
- What are the tradeoffs to urban development?
Sources:
- Landsat Collection 2 Surface Temperature | US Geological Survey. (n.d.). USGS.gov. Retrieved May 24, 2022, from https://www.usgs.gov/landsat-missions/landsat-collection-2-surface-temp…
- Landsat Normalized Difference Vegetation Index | US Geological Survey. (n.d.). USGS.gov. Retrieved May 24, 2022, from https://www.usgs.gov/landsat-missions/landsat-normalized-difference-veg…
Teacher Note
Teachers, these mini lessons/student activities are perfect "warm up" tasks that can be used as a hook, bellringer, exit slip, etc. They take less than a class period to complete. Learn more on the "My NASA Data What are Mini Lessons?" page.
Teachers who are interested in receiving the answer key, please complete the Teacher Key Request and Verification Form. We verify that requestors are teachers prior to sending access to the answer keys as we’ve had many students try to pass as teachers to gain access.
Disciplinary Core Ideas:
- ESS3A: Natural Resources
- ESS3C: Human Impacts on Earth Systems
Crosscutting Concepts:
- Cause and Effect
Science and Engineering Practices:
- Analyzing and Interpreting Data