
Grade Level: 3-5,
6-8,
9-12
The Earth System Satellite Images, along with the Data Literacy Cubes, help the learner determine relationships among variables.
Energy powers the transformation and movement of matter in all Earth system processes. Earth’s major cycles connecting matter found within the different spheres include the energy cycle, the water cycle, and the cycles of important individual elements (e.g., carbon and nitrogen).


Students move through a series of short activities to explore and evaluate global solar radiation data from NASA satellites. In this process, students make qualitative and quantitative observations about seasonal variations in net energy input to the Earth System.


Students analyze map visualizations representing the amount of Sun’s energy received on the Earth as indicated by the amount that is reflected back to space, known as “albedo”.
Students will analyze and interpret graphs to compare the flow of (shortwave) energy from the Sun toward China over the course of a year on cloudy versus clear days. Students will draw a conclusion and support it with evidence.

Students will analyze and interpret maps of the average net atmospheric radiation to compare the flow of energy from the Sun toward Earth in different months and for cloudy versus clear days. Students will draw conclusions and support them with evidence.

Students will analyze surface temperature and solar radiation data to construct explanations about the relationship of seasons and temperature to the amount of solar energy received on Earth’s surface.
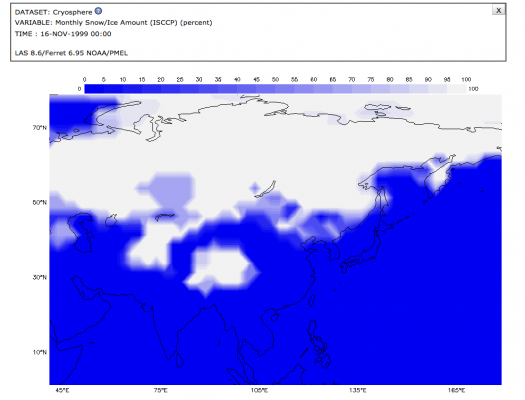
In this lesson, Observing Earth’s Seasonal Changes, students observe patterns of average snow and ice amounts as they change from one month to another, as well as connect the concepts of the tilt and orbit of the Earth (causing the changing of seasons) with monthly snow/ice data from January 2008

Air, Water, Land, & Life: A Global Perspective
The Earth System Satellite Images, along with the Data Literacy Cubes, help the learner determine relationships among variables.
The Earth System Satellite Images, along with the Data Literacy Cubes, help the learner visualize how different Earth system variables change over time, identify patterns, and determine relationships among two variables in three months.

The Earth System Satellite Images, along with the Data Literacy Cubes, help the learner visualize how different Earth system variables change over time, establish cause and effect relationships, identify patterns, and determine relationships among variables.
The Earth System Satellite Images, along with the Data Literacy Cubes, helps the learner identify patterns in a specific image.

The Earth System Satellite Images, help the learner visualize how different Earth system variables change over time, establish cause and effect relationships for a specific variable, identify patterns, and determine relationships among variables over one year.
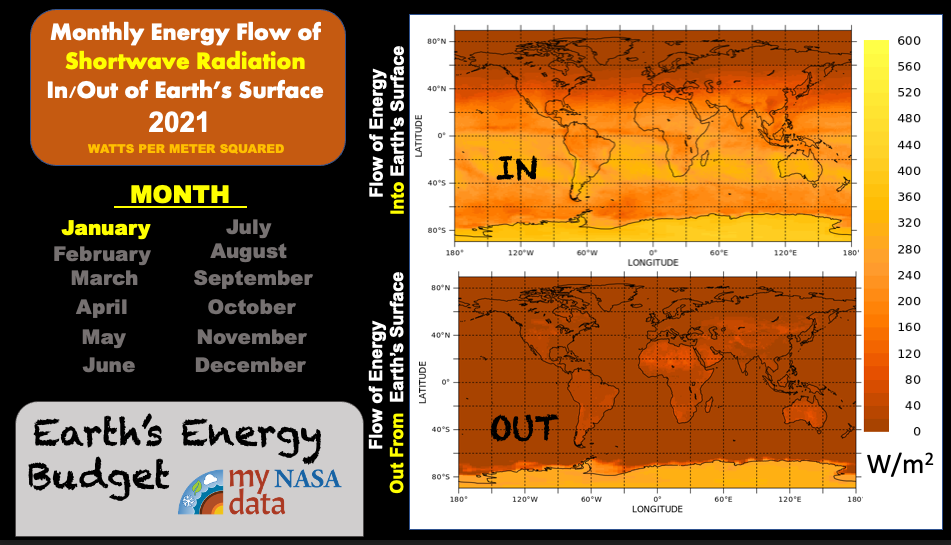
Students construct explanations about Earth’s energy budget by connecting a model with observations from side-by-side animations of the monthly mapped data showing incoming and outgoing shortwave radiation from Earth’s surface.
Students will examine how radiation, conduction, and convection work together as a part of Earth’s Energy Budget to heat the atmosphere.
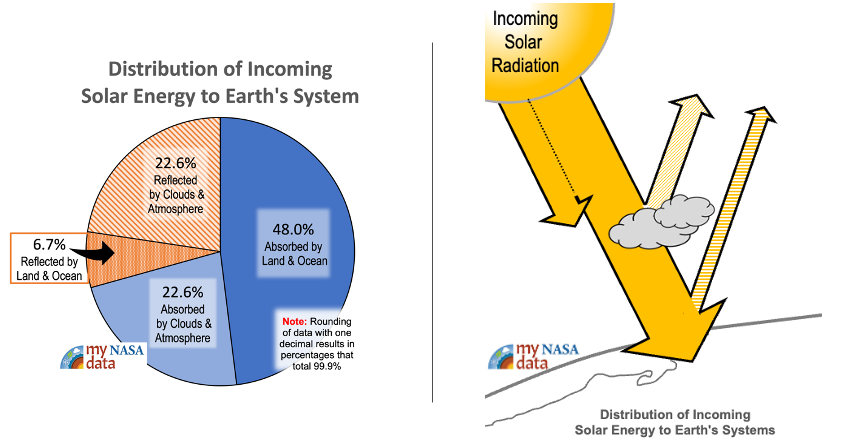
A kinesthetic activity that challenges students to participate in a model that describes the fate of solar energy as it enters the Earth system. A good initial lesson for Earth’s energy budget, students unravel the benefits and limitations of their model.
Students collect and analyze temperature data to explore what governs how much energy is reflected.
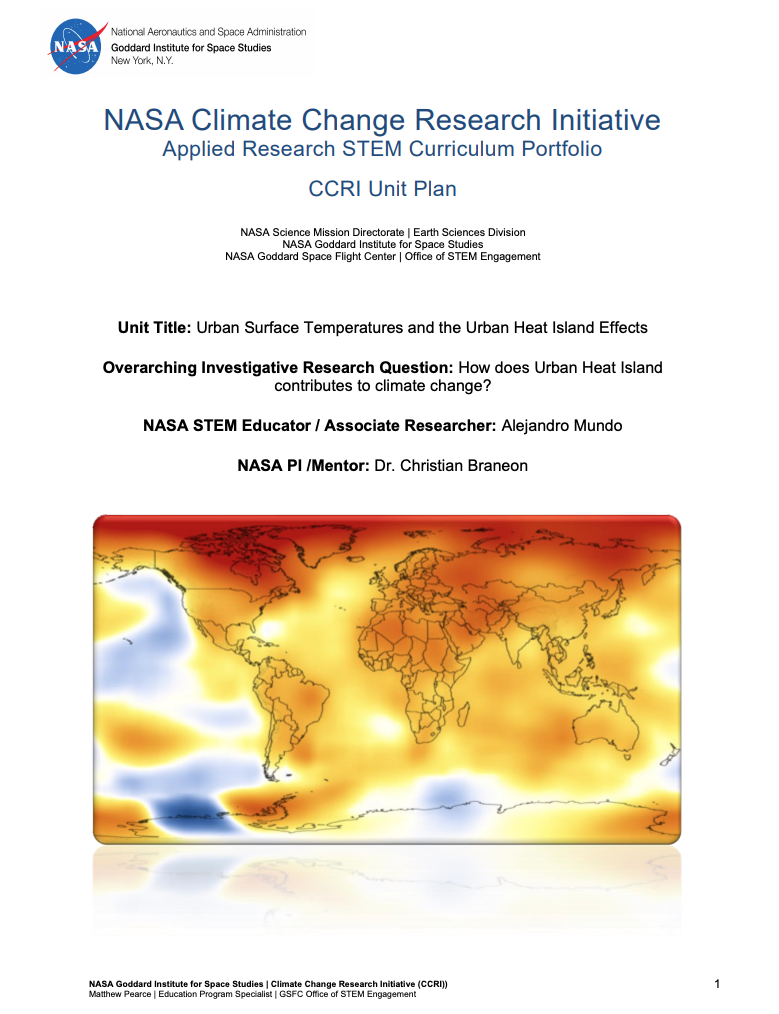
This unit plan is published by the NASA Climate Change Research Initiative's (CCRI) Applied Research STEM Curriculum Portfolio. The CCRI Unit Plan, called “Urban Surface Temperatures and the Urban Heat Island Effects,“ has the purpose to educate students how climate is changi