Lesson Plans
Air, Water, Land, & Life: A Global Perspective
Overview
In Part A of this lab, students will examine a variety of images and maps of the whole Earth in order to identify the major components of the Earth system at a global scale. In Part B, students will play a game that will help them better understand the water cycle and its importance within the Earth system. They will then describe the water cycle at the global scale in greater detail, identify the components through which water passes and the processes that move it, and draw an abstract diagram.
This lesson is modified from the EarthLab lesson developed by Science Education Resource Center. ![]()
Procedure
Keeping Track of What Is Learned
Throughout these labs, there are two kinds of questions.
- Checking In questions are intended to keep students engaged and focused on key concepts and to allow the user to periodically check if the material is making sense. These questions are often accompanied by hints or answers to let students know if they are on the right track.
- Stop and Think questions are intended to help the teacher assess student understanding of the key concepts and skills students should be learning from the lab activities and readings.
Part A: Viewing Earth from Space
NASA's Blue Marble
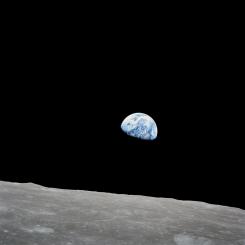
The full-Earth images below are the western- and eastern-hemisphere views of NASA's spectacular "blue marble" image of Earth. Scientists and visualizers created these true-color images by stitching together months of observations of the land surface, oceans, sea ice, and clouds into a seamless, true-color mosaic of every square kilometer (0.386 square mile) of our planet. Click here to learn more about these images.
- Have students carefully examine the "blue marble" images below.
-
Students should identify elements of the four major components of the Earth system (atmosphere, hydrosphere, pedosphere, biosphere).
https://d32ogoqmya1dw8.cloudfront.net/images/eslabs/climate/nasa_blue_marble_montage.jpg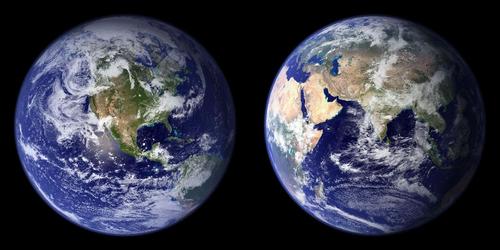
Images courtesy of NASA. Click image to enlarge.
NASA NEO
- Students work in small groups to explore satellite images and data maps of the four components of the Earth system. Each group will explore at least one image from each category. Here are some suggested datasets for each group.
Group 1—Energy
Dataset Options:
- Solar Insolation
- Net Radiation
Group 2—Atmosphere
Dataset Options:
- Aerosol Optical Thickness
- Cloud Fraction
- Rainfall
Group 3—Ocean
Dataset Options:
- Sea Surface Temperature (MODIS 2002+)
- Sea Ice and Snow Extent, Northern Hemisphere
Group 4—Land
Dataset Options:
- Land Surface Temperature [Day]
- Land Surface Temperature [Night]
- Land Cover Classification
Group 5—Life
Dataset Options:
- Vegetation Index
- Population
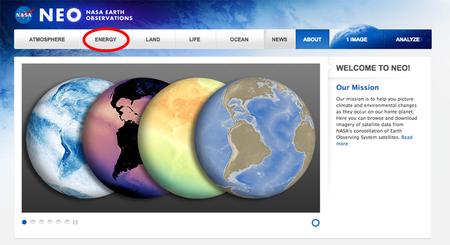
2. Direct students to go to the NASA Earth Observations (NEO) website. The NEO Web site will open in a new browser window.
3. NEO organizes datasets into five categories: Ocean, Atmosphere, Energy, Land, and Life. Click on one of the buttons to see the list of available datasets for each category.
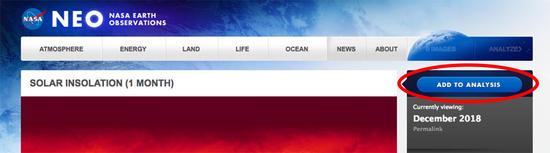
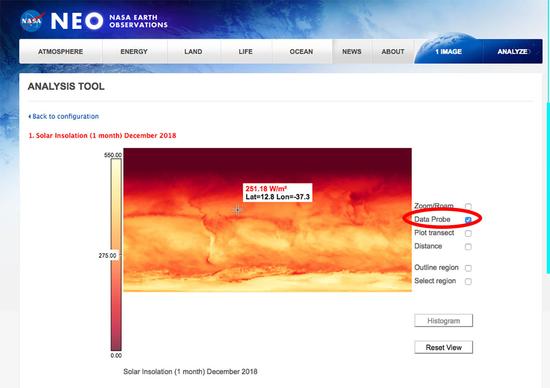
4. Students select the dataset they want to display on the map. The display window loads the most recent map.
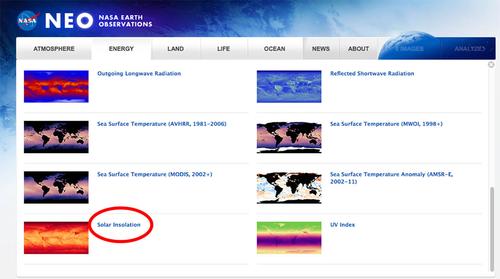
The display window loads the most recent map of Solar Insolation.
5. Students carefully examine the map.
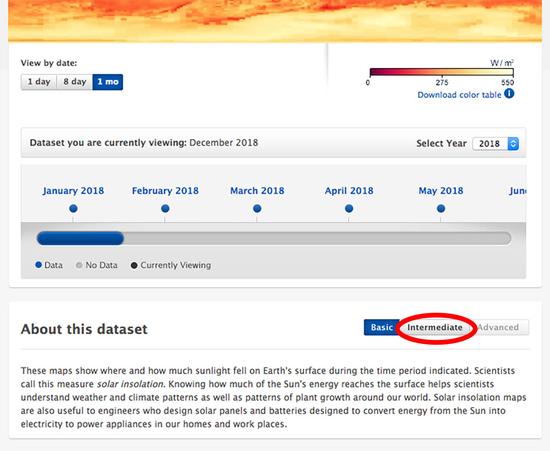
6. Find out about the dataset used to produce the map.
- Scroll down to About this dataset to learn more details about what the map is showing.
7. Students will work together to explore their dataset in more detail using NEO's Image Composite Explorer (ICE) Tool. Click Add to Analysis to add it to the Analyze box (grayed out) above.
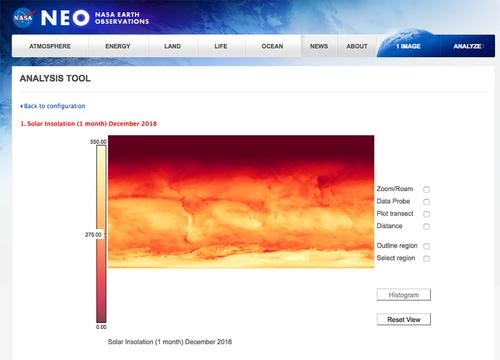
8. Click Analyze. A new Analysis Options window will open.
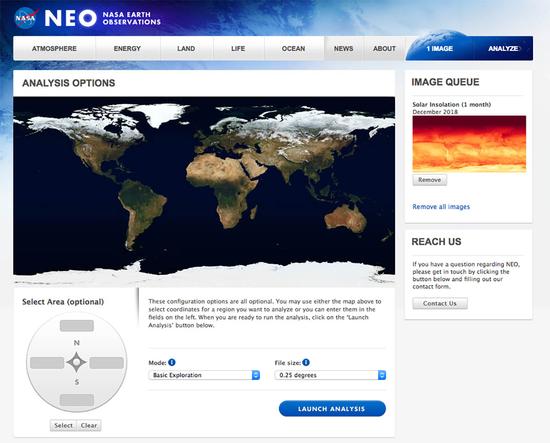
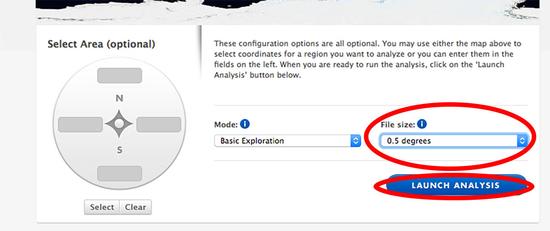
9. Click on the field below File size in the Select Area box below the image and set the resolution to 0.5 degrees. This will help the image load faster for analysis. Then click Launch Analysis.
10. Once the scene loads, click the checkbox for Data Probe and begin exploring the image. Move the mouse over the image to display latitude, longitude, and values for data points on the map.
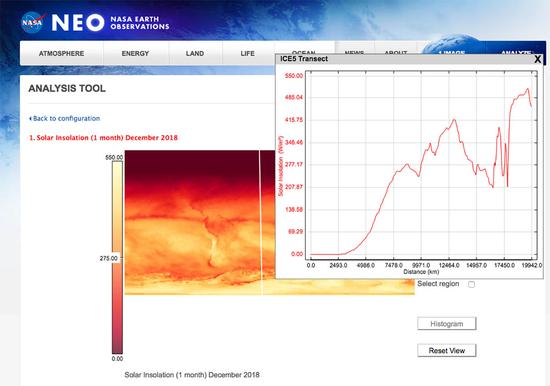
11. Click the checkbox for Zoom/Roam to zoom in on areas of interest. Click the Reset View button to reset the image. To simultaneously explore the data in the image both visually and graphically, try selecting the Plot Transect feature (a transect is a path along which observations are made). Click and drag the mouse across the image to define a transect. Experiment with different areas of the world. Try plotting North-South and East-West transects to look for patterns in the data. Notice that as the cursor moves, a graph is generated. Click the X in the upper right of the graph to close.
12. As a group, students continue to explore their image and come up with answers to the following Stop and Think questions:
Stop and Think
1: What variable did you examine and what is the range of values shown on the scale bars?
2: Where in the world do you find the highest and lowest values (the extremes) of the data in your images?
3: Why do these locations experience the extremes and not other locations?
4: Are there any noticeable patterns in the data? Are patterns different on different continents? Are patterns different over water than over land? Explain these patterns.
13. The group designates a spokesperson to report their observations.
14. This student shares what they found with the rest of the class and include answers to the Stop and Think questions in the group's presentation.
15. The class discusses interconnections between the datasets examined by each group. For example, do the maps hint at any relationships between insolation and water or land surface temperatures? Between total rainfall and vegetation index?
Part B: The Water Cycle
The abundance of water on Earth makes our home planet a uniquely livable world. Water sustains life and is an important link between each of the four "spheres" of the Earth system (hydrosphere, atmosphere, pedosphere, biosphere). The water cycle, which describes the continuous movement of water on, above and below the surface of the Earth, includes all water processes: precipitation, evaporation, freezing, melting, and condensation. Earth's climate and climate variability are largely driven by the cycling of water and energy exchanges among the ocean, atmosphere, and land.
- Students play the NOAA Water Cycle Game - This role-playing game will help them gain a better understanding of the complex journey a water molecule takes as it moves through the water cycle. Each player will simulate the movement of water within the water cycle. The teacher should set up stations representing nine different compartments of the water cycle. On each turn, students will roll dice to determine where to move next. Colored trackers record each person's unique journey through the water cycle so they can compare the journey to those of others after they are done playing. During the game, students will identify the states of water and when water changes states as it moves through the water cycle. They will also learn where pollutants can enter the water cycle, be transported, or get left behind.
Stop and Think
1: After students play the Water Cycle Game, they think about the pathways that water takes through the Earth system. Tell the story of a drop of water, and describe what happens to it. Through which components does it travel, and how does it get there? Students describe the water drop's path as a series of steps.
For example:
Step 1. It rains, and the water drop falls near my house.
Step 2. The water is absorbed by the soil.
You can add any details that you imagine. Remember to include the various forms that water takes (solid, liquid, and gas).
Turn the water drop into a world traveler, and take it across the globe. Don't leave it in the neighborhood!
2: Students now return back through the steps. After each one, they write the name of the system components that were involved. For example, if they wrote, "It rains, and the water drop falls near my house," after that, the student would write "atmosphere." If they wrote, "The water is absorbed by the soil," after that, they would write, "Soil," or "Pedosphere."Which of the four major components of the Earth system are involved in the water cycle?
Diagram the Water Cycle
- Distribute a clean sheet of paper to students. They should write the names of the four major components of the Earth system, far apart from each other on the page. (It doesn't matter in what order the students write them.)
-
Direct students to draw a circle around each name. For each step in the water pathway during which water moved from one major Earth system component to another, draw an arrow between the two components. For example, if students described water being evaporated from the ocean, draw an arrow from the ocean to the atmosphere.
- Along the shaft of each arrow, students write a short phrase describing how the water moved from one component to the other. For example, on the shaft of the arrow from the ocean to the atmosphere, students would write, "Water evaporates from the ocean."
- Students will do this for all the water pathway steps that involve water moving from one system component to the other.
Disciplinary Core Ideas:
- ESS2A: Earth Materials and Systems
Crosscutting Concepts:
- Patterns
- Scale, Proportion, and Quantity
- Systems and System Models
Science and Engineering Practices:
- Analyzing and Interpreting Data
- use images and data about the whole Earth to identify the major components of the Earth system at the global scale
- describe the pathway of water among the four components of the Earth system, as an example of ways they are interconnected
- translate understanding of that pathway into an abstract diagram
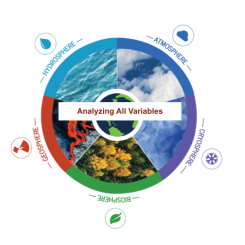
- How are energy and matter exchanged among the four main components of the Earth system (atmosphere, biosphere, hydrosphere, pedosphere)?
If we were only able to observe the Earth from the ground, we would never be able to get a truly global view of the Earth system and the interactions among air, water, land, and life. The single best vantage point from which to learn the most about Earth, is from high above the surface. Fortunately, satellite technology has afforded us the ability to view Earth from the unique perspective of space.
Satellites acquire new images of Earth all the time. Images from Earth-observing satellites show us enough of the Earth at once that we can see large-scale phenomena and interactions such as the spread of air pollution, damage from earthquakes, volcanoes, fires, or the entire span of a hurricane. Satellites can also track temporal changes to show things like deforestation, sea level rise, or ozone depletion. Observing Earth over time from space will enable us to evaluate the progression of climate change and the global impacts of human activity.
Before satellites, remote sensing images were obtained in a variety of creative ways. Early remote sensing images in the mid to late 1800s were taken by hot-air balloonists. In 1897, Alfred Nobel (for whom the Nobel prize is named) took the first aerial photograph from aboard a rocket. In the early twentieth century, remote sensing images were even taken by cameras strapped to fleets of pigeons and kites. As technologies advanced throughout the 1900s, remote sensing via cameras aboard airplanes became valuable for things like wartime reconnaissance, urban development, disaster damage assessment, land use surveys, agricultural status, and oil exploration. But it wasn't until the latter half of the twentieth century, with the development of artificial satellites, that remote sensing expanded to the global scale. Today, more than a dozen NASA satellites keep constant watch over Earth.
Credit: SERC
If we were only able to observe the Earth from the ground, we would never be able to get a truly global view of the Earth system and the interactions among air, water, land, and life. The single best vantage point from which to learn the most about Earth, is from high above the surface. Fortunately, satellite technology has afforded us the ability to view Earth from the unique perspective of space.
Satellites acquire new images of Earth all the time. Images from Earth-observing satellites show us enough of the Earth at once that we can see large-scale phenomena and interactions such as the spread of air pollution, damage from earthquakes, volcanoes, fires, or the entire span of a hurricane. Satellites can also track temporal changes to show things like deforestation, sea level rise, or ozone depletion. Observing Earth over time from space will enable us to evaluate the progression of climate change and the global impacts of human activity.
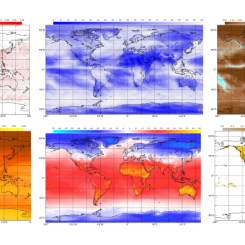
Earth system processes take place in and between the atmosphere, water, soil, and living components of the planet. These processes also include energy from the Sun, and the gases and particles that enter the atmosphere and oceans from both natural and anthropogenic (human-related), sources. The NASA Earth Observations (NEO) site is a great place to find imagery of NASA Earth science datasets. NEO has over 20 distinct energy, atmosphere, ocean, land, and life datasets, which are available as global snapshots in daily, weekly, and monthly time spans. In this part of the investigation, students will examine images of the Earth, looking for available information (data displayed, unit of measure, a range of values, etc.) than for any noticeable patterns within the image.
Credit: SERC
This lab is contained within a larger unit where Earth System Science is the focus. See the links at the bottom for the full suite of labs within this unit.
- One-to-One (tablet, laptop, or CPU)
Complementary Lesson Plans
Complementary Pages


Grade Band
- 6-8
- 9-12
Time
- 50 minutes
Visualization Tool
NGSS Three Dimensional Learning
- See drop-down menu at the bottom of the page