Lesson Plans
Observing Earth’s Seasonal Changes
Overview
In this lesson, Observing Earth’s Seasonal Changes, students observe patterns of average snow and ice amounts as they change from one month to another, as well as connect the concepts of the tilt and orbit of the Earth (causing the changing of seasons) with monthly snow/ice data from January 2008 to June 2008.
Materials Required
Per Student:
- Scientists Monthly Mix-Up Datasheet
- Our Investigation! Student Datasheet
Per Group:
- Copy of Student Pages: January, March, and June 2008 Snow/Ice maps
- Copy of Student Pages: January, March, and June 2008 Monthly Leaf Area Index maps
Procedure
Part 1: Honing Our Observation Skills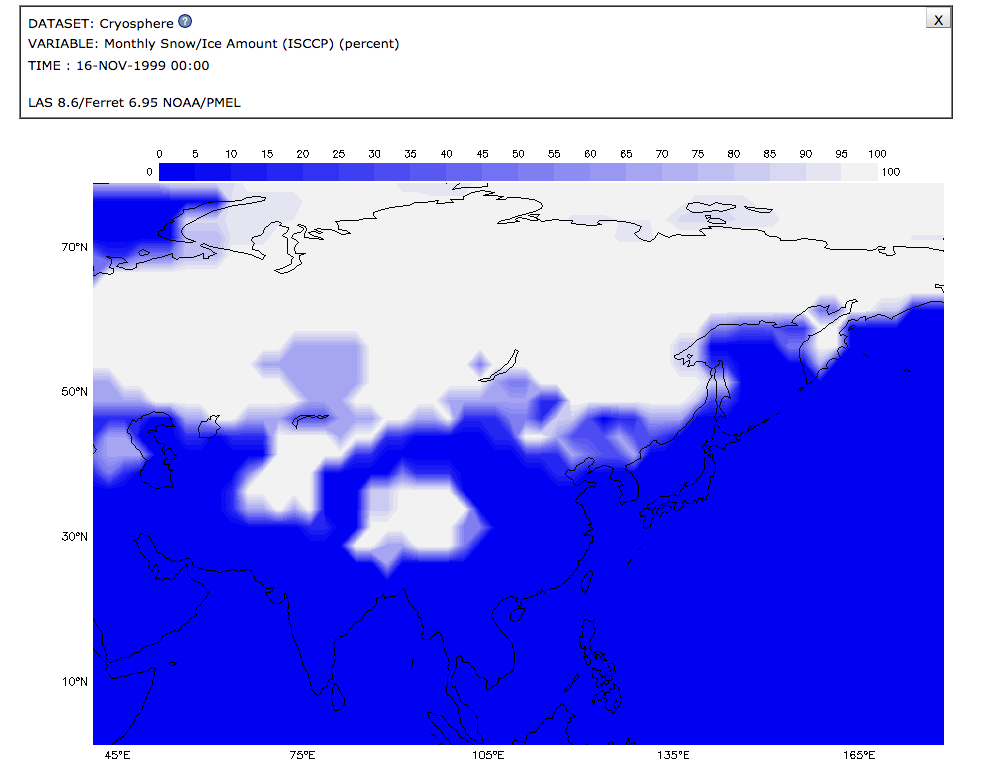
-
Distribute and review the Model Data Visualization of Snow/Ice Amount (percent) for November 1999, as well as the Student Datasheet: Scientists Monthly Mix-Up Datasheet as a class.
-
First, direct students’ attention to the visualization’s scale and gradient that appears on top of the image. Be sure to explain that the lighter the map gets, the more snow accumulated in that area during that month.
-
Ask students:
-
What continent is featured in the visualization?
-
What do you observe?
-
How does this continent’s climate compare to where you live?
-
Which latitude shows the most amount of snow? Least? Which longitude shows the most amount of snow? least?
-
-
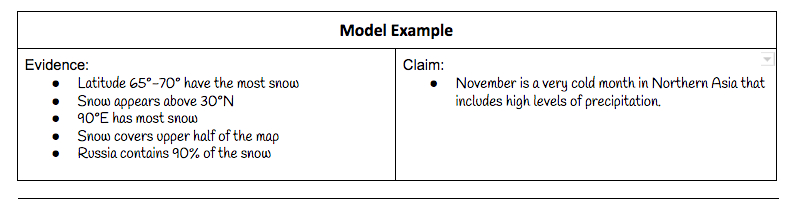
Walk students through the process of collecting at least three explanations of evidence for each map using qualitative and quantitative data, such features as latitude, longitude, percent coverage, etc.
-
Next, have them create a “claim” that includes an explanation of this evidence in the Claim column.
Part 2: Using Observations to Solve the ‘Data Mix-Up’ Problem
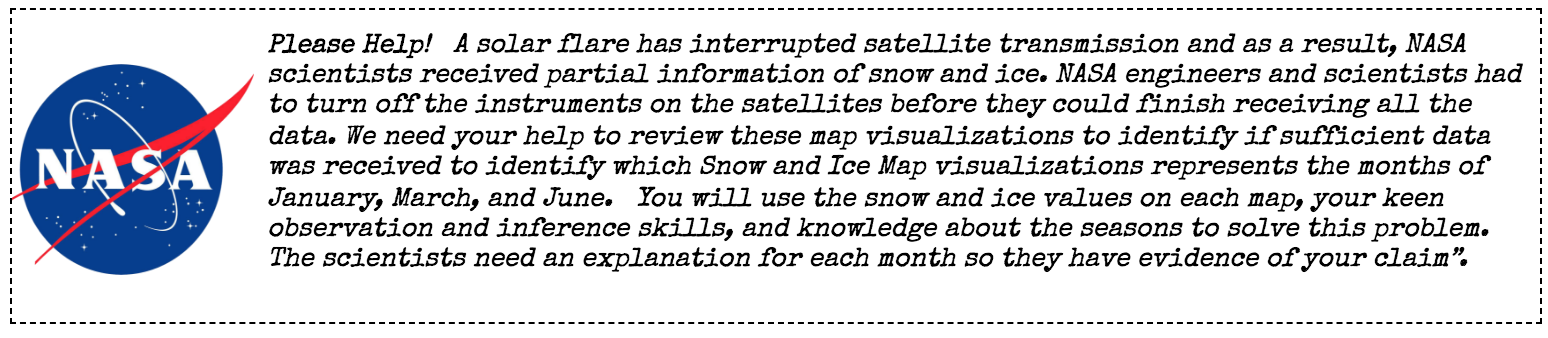
Read the scenario to the students:
-
Break students into groups. Provide each group with three maps (January - #3, March #1, and June 2008 - #2) . NOTE: Students should not know the months’ names of the maps in order to set up the scenario. Be sure to print the Student Page of the Data Visualization, rather than the Teacher Page.
-
To pique their observations skills, play the Snow and Sea Ice on the Poles. Clarify to the students that the data that they will receive was obtained using NASA satellite data. Using the Snow/Ice data as evidence, they will make claims as to the time of year the map represents.
-
Select #1 and #2 as a class to do a comparison.
-Which one shows the higher amount of snow and ice? Explain.
-What month can you infer is a warmer month? Why?
-
Students continue in their groups making observations and discussing what they notice about the visualizations. NOTE: If students become stuck, here are some questions to help guide them:
-
Where is most of the snow/ice located? (At which latitude and longitude?)
-
How far does the snow/ice extend? (Between which latitudes and longitudes).
-
Looking at North America (or applicable continent), how do we figure out what month it is based on knowing the weather patterns where you live?
-
What season is shown in each of these maps?
-
-
After students have completed the datasheet, students share out their group’s explanations and explain the correct answers.
-
Using PBS’s interactive visualization, ‘Why Do We Have Seasons?’ review and describe the phenomenon of seasons. The teacher should look at each city’s tab on the visualization (New York, US; Miami, US; Singapore; and Melbourne, Australia) and each of the three months (Early February, March, and June). Be sure to describe why the sunlight hits at different intensities, even though the Earth is in a mostly circular orbit. Possible misconceptions should be addressed here.
-
Distribute the Student Pages of the Monthly Leaf Area Index maps for January, March, and June 2008 and the Our Investigation! Student Datasheets to students.
Part 3: Exploring Related Datasets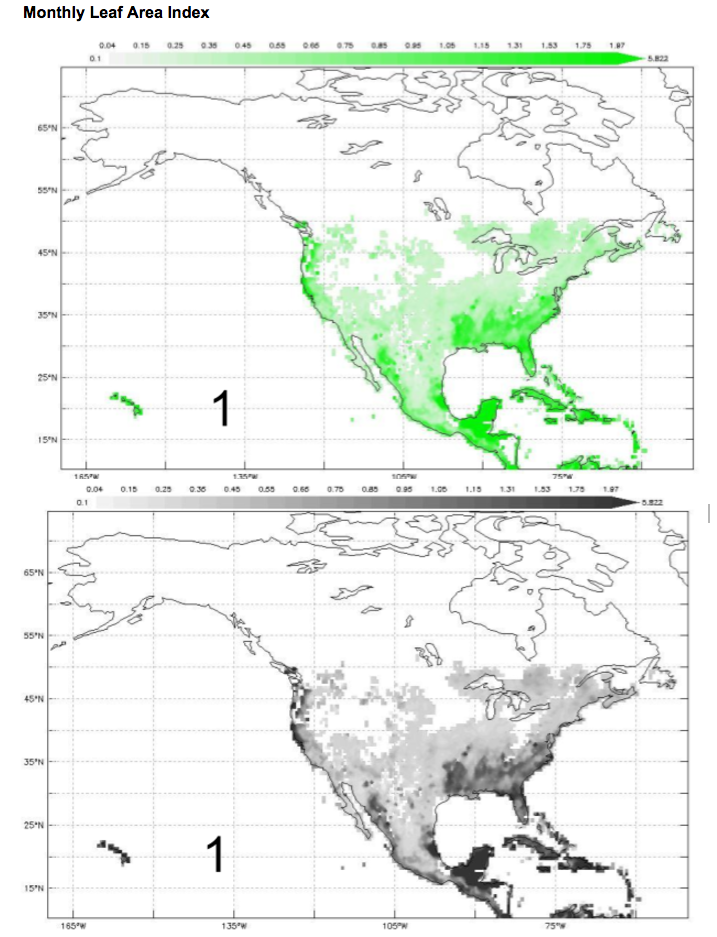
-
Ask students to predict the meaning of the Monthly Leaf Area Index variable. Direct students to observe the darker greens (or grays) show where more tree canopy cover exists in that area and the lighter areas are where less canopy cover occurs. (Tree Canopy Cover is the layer of tree leaves, branches, and stems that cover the ground when viewed from above.) Be sure to acknowledge that areas that are shades of green (or gray if in grayscale) contain canopy cover.
-
Review the Our Investigation! Student Datasheet with students. Students now repeat the process of making observations, collecting evidence on their datasheet, and writing claims.
-
Once students have filled out the table, have them discuss in their groups and answer the questions on the bottom of their datasheet.
Disciplinary Core Ideas:
- ESS2A: Earth Materials and Systems
- ESS2D: Weather and Climate
Crosscutting Concepts:
- Patterns
Science and Engineering Practices:
- Developing and Using Models
- Analyzing and Interpreting Data
- Obtaining, Evaluating and Communicating Information
- The student will be able to use evidence to create an explanation.
- The students will be able to construct a graph or model using scientific principles.
- The students will be able to describe expected weather conditions for a particular season.
- The students will be able to employ observations in order to explain a phenomenon.
- What types of weather conditions are associated with each of the different seasons?
- How do the seasons differ between hemispheres?
- What factors affect the type of climate found in a particular region of the world?
Earth’s surface is a complex and dynamic set of interconnected systems – principally the geosphere, hydrosphere, atmosphere, and biosphere. All of the Earth’s processes are the result of energy flowing and matter cycling within and among these systems. Weather and climate are shaped by complex interactions involving sunlight, the ocean, the atmosphere, clouds, land, ice, and life forms.
The seasons are caused as the Earth, tilted on its axis, travels in its orbit around the Sun each year. The hemisphere that is tilted towards the Sun is warmer for two reasons. First, the sunlight shines more directly to the Earth’s surface in the hemisphere that is tilted towards the Sun, concentrating the sun’s energy at the surface. A good way to visualize this is to shine a flashlight on a wall at different angles. When the flashlight pointed more directly at the wall (this represents sunlight in the summer hemisphere), the light hitting the wall is brighter than if the flashlight is more angled (this represents sunlight in the winter hemisphere). Second, there is less scattering of the Sun’s radiation by the atmosphere when the Sun shines more directly.
- Seasonal changes in weather
- Names of continents
- Basic ability to read a map
- Cardinal directions
- Revolution and orbit (Earth travels around the sun)
- Weather patterns are not the same around the world
- Familiarity with Earth’s systems and biomes
- “Often students who believe that the seasons are caused by Earth’s distance to the sun think that Earth orbits the sun in an elongated elliptical path and that this is what causes Earth’s distance from the Sun to vary enough to cause the seasons In fact, Earth’s orbit, while elliptical, is nearly a perfect circle.”
- “Others may think that the sun is not in the center of Earth’s orbit, thus causing Earth to be closer or farther away from the Sun at different times. While it’s true that the Sun is at one focus of Earth’s elliptical orbit, the fact that the orbit is nearly a perfect circle means that the distance from Earth to the Sun remains nearly constant all year.”
- “Even people that know that Earth’s tilt has something to do with the seasons might think that there is something about the tilt that causes Earth to be much closer to the Sun at certain times of the year. In fact, the tilt does not make any significant difference in the distance of Earth to the Sun.”
Credit: AAAS Science Links
National Geography Standards:
-How to use maps and other geographic representations, tools, and technologies to acquire, process, and report information from a spatial perspective.
Why is it that when the Earth is closest to the sun, the Northern Hemisphere has winter? And when they are farthest from the sun, they have summer? This phenomenon occurs because of Earth’s tilt, which causes the seasons to occur and thus the climate of that region. Climate describes patterns of typical weather conditions over different time scales. NASA scientists use data from multiple satellites to analyze historical weather patterns to answer questions related to climate. GLOBE and My NASA Data enable educators and students to connect with NASA scientists and access the satellite data to answer their own questions related to atmospheric interactions that affect our weather and climate. In this lesson, Observing Earth’s Seasonal Changes, students will observe patterns of average snow and ice amounts as they change from one month to another, as well as connect the concepts of the tilt and orbit of the Earth (causing the changing of seasons) with monthly snow/ice data from January 2008 to June 2008.
- Atmospheric and Space Scientists – Investigate weather and climate-related phenomena to prepare weather and climate-related phenomena to prepare weather reports and forecasts for the public
- Computer and Information Scientists – Conduct research in the field of computer and information science
- Cartographers and Photogrammetrists – Collect, analyze, and interpret geographic data in the creation of maps
- Applications Software Developers – Develop and modify computer applications software that are used to communicate with satellites and people using satellite data
Complementary Lesson Plans

Grade Band
- 3-5
Time
- 90 minutes
Visualization Tool
NGSS Three Dimensional Learning
- See drop-down menu at the bottom of the page