Mini Lesson/Activity
Exploring Cryosphere Seasonal Thaw and Energy Budget
Overview
Students analyze two North Pole orthographic data visualizations produced from soil moisture data. After describing trends in the seasonal thaw of land surfaces, students demonstrate their understanding of Earth’s energy budget by explaining relationships and make predictions about the dataset.
Student Directions
Soil moisture data was evaluated at Earth’s most northern region. The data from NASA's Soil Moisture Active Passive (SMAP) observatory is used to classify the Earth’s surface as frozen or solid. As liquid water freezes in soil, the water molecules become bound in a crystalline lattice, which changes how the incoming radar energy from SMAP interacts with Earth's surface, compared to soil containing freely oriented liquid water molecules. As a result, these data products reveal the freeze-thaw patterns of surface soils in the region of interest.
Getting Oriented: Use the map projections below to develop the necessary spatial orientation used with this dataset.
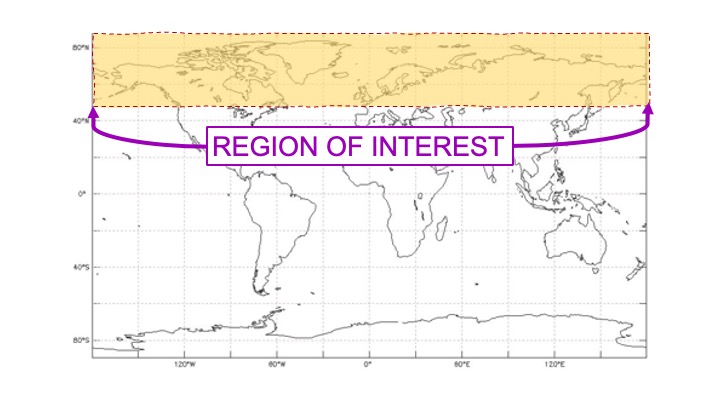
A geographic projection world map shows the region of interest above 45 degrees northern latitude.
https://mynasadata.larc.nasa.gov/sites/default/files/inline-images/AOI_seaonalthaw_lesson%20world%20map.jpg
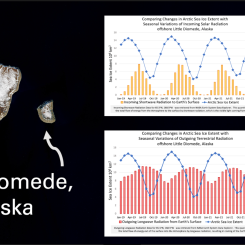
Analzing the Dataset: Below are the freeze-thaw data visualizations that have been created from soil moisture data collected from NASA's Soil Moisture Active Passive (SMAP) observatory. Use these data to answer the questions below to explore connections to Earth’s energy budget. Check with your instructor on how to submit your answers.
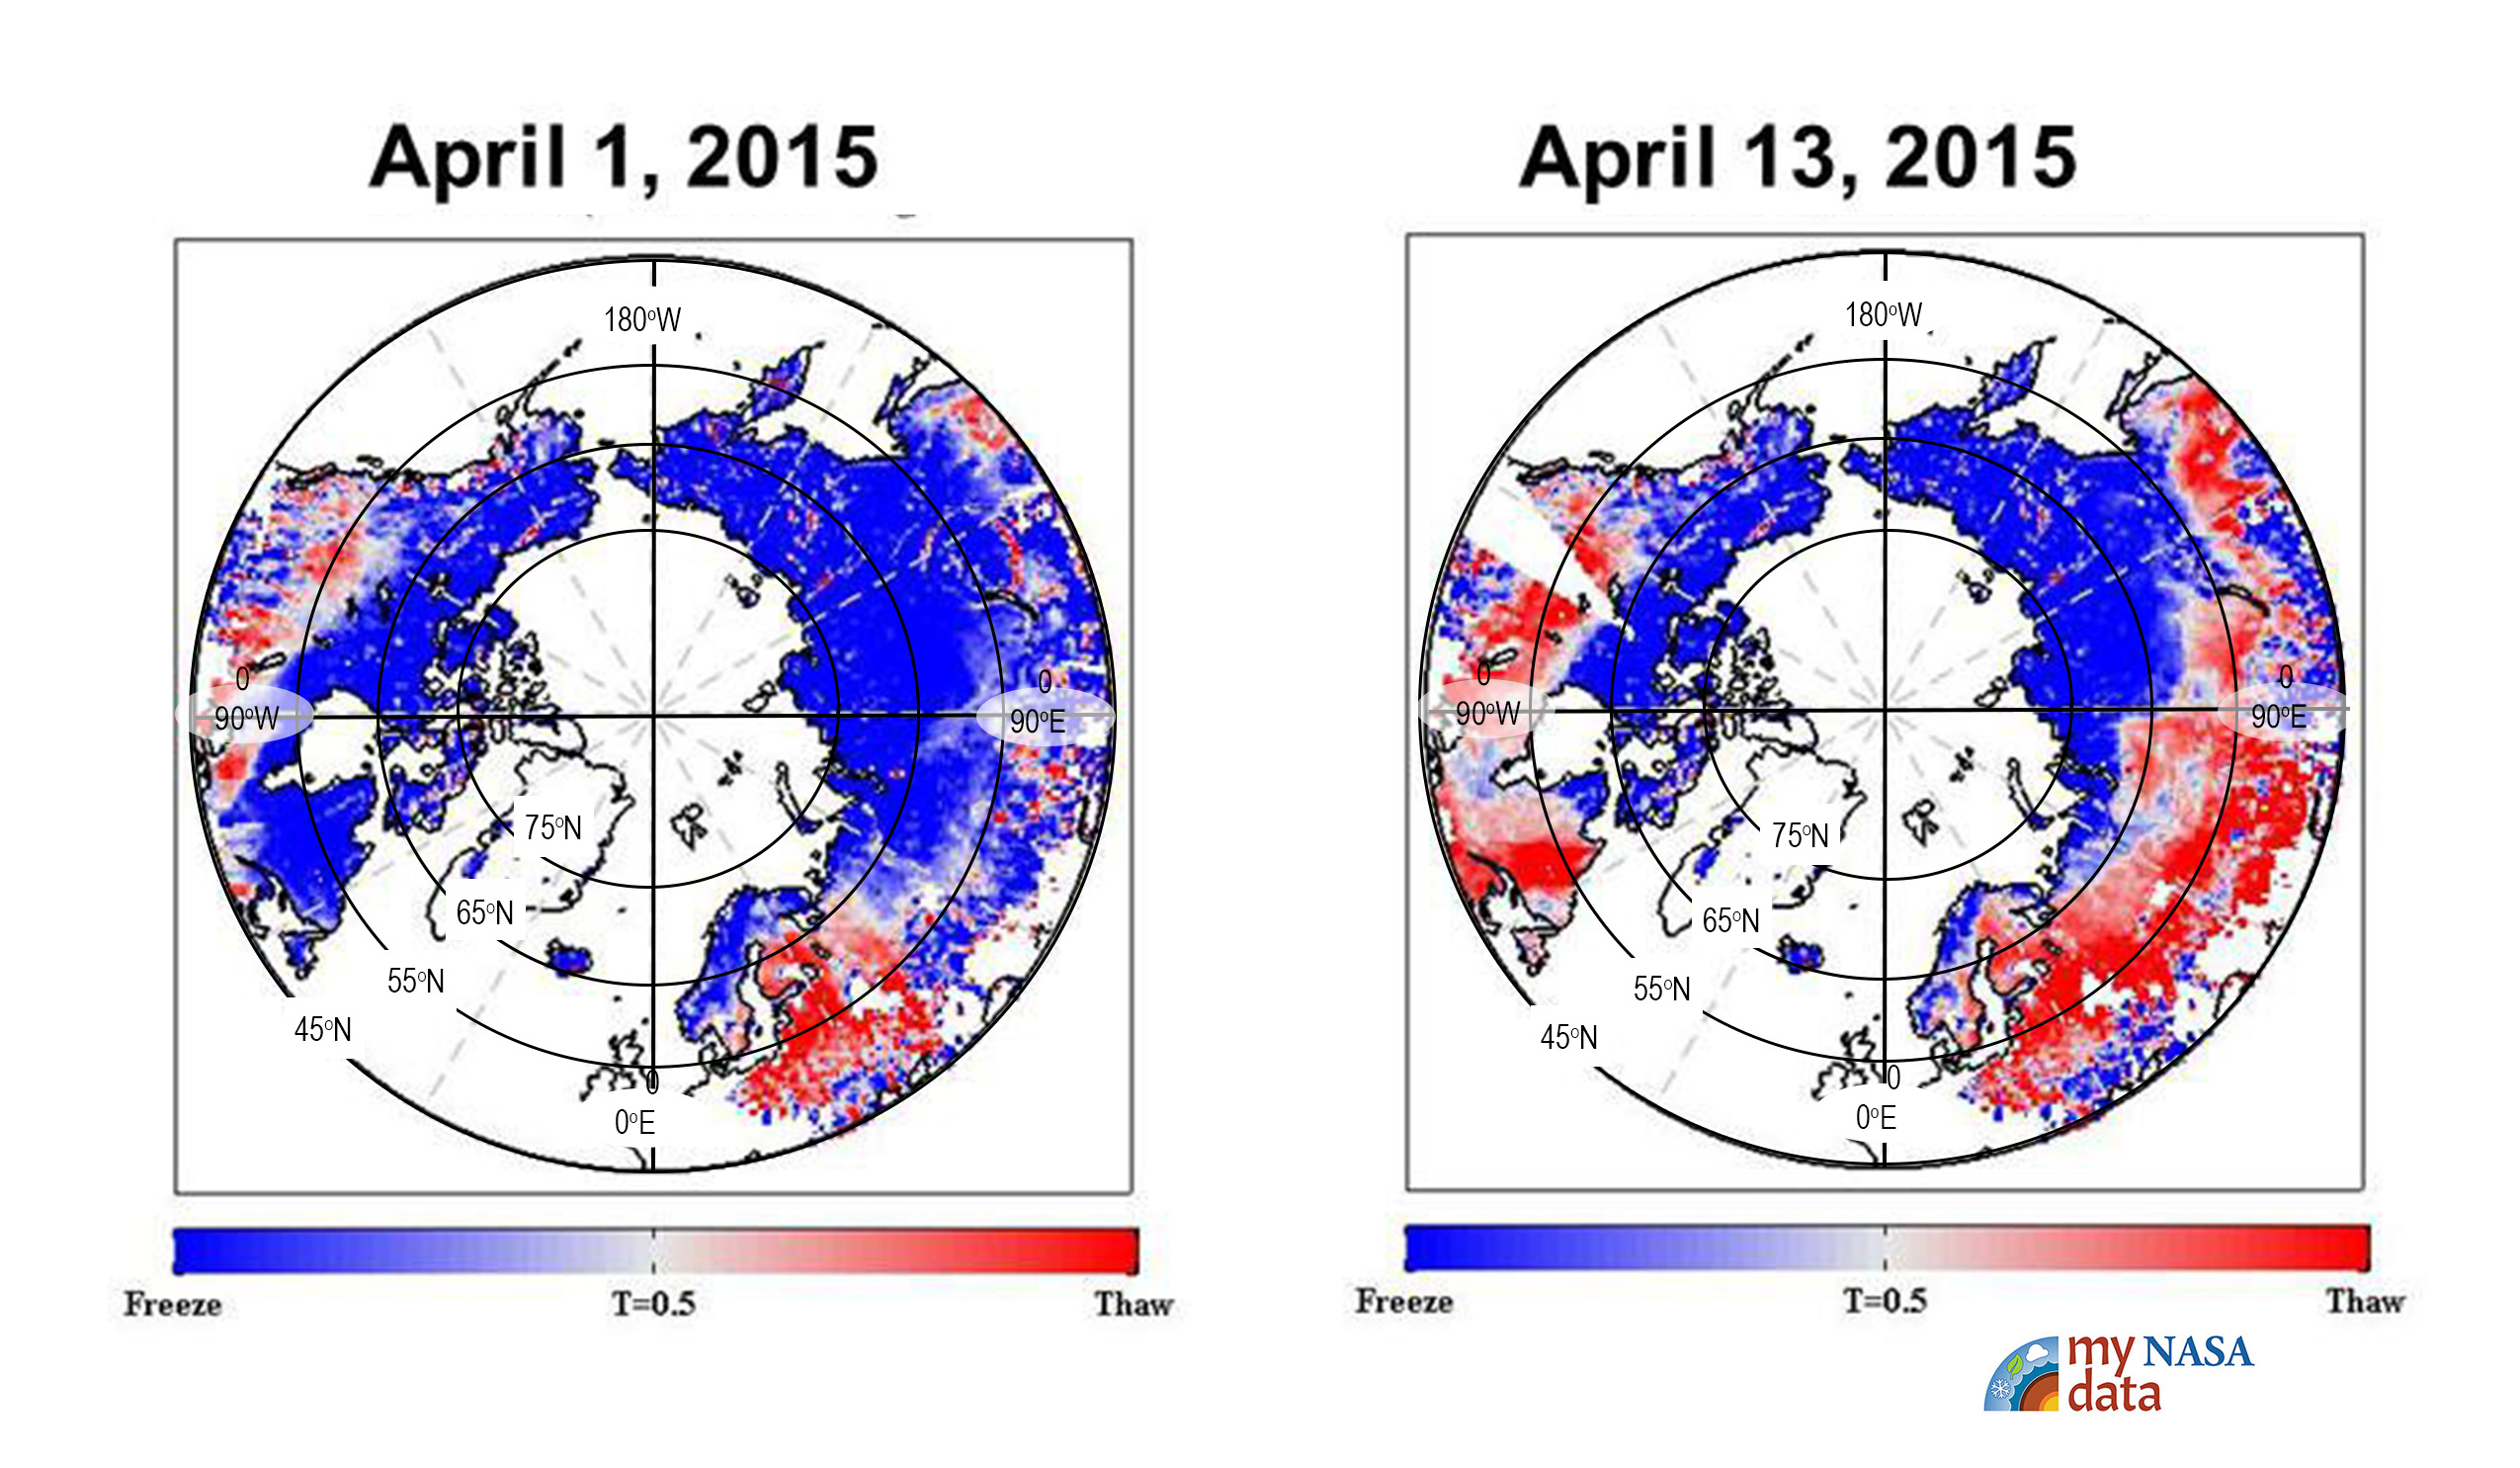
North Pole orthographic projection world map showing freeze-thaw data from April 1, 2015 and April 13, 2015.
Credit: Image adapted for educational purposes. Original data presentation from NASA/JPL-CalTech
https://www.jpl.nasa.gov/images/pia11399-nasa-smap-images-show-progression-of-spring-thaw-in-northern-hemisphere
https://mynasadata.larc.nasa.gov/sites/default/files/inline-images/FreezeThawDATA_lesson%20color%20polar%20view.jpg
- Describe patterns and trends in data.
- Identify the range of latitudes (between ____oN and ___oN) that have experienced the greatest amount of change in land surface conditions during the time of study.
- On one of the lines of latitudes you identified above find the following:
- The land surface conditions at (____oN and ___oE/W) changed from being frozen to thawed between April 1, 2015 and April 15, 2015.
- The land surface conditions at (____oN and ___oE/W) remains frozen between April 1, 2015 and April 15, 2015.
- Explain patterns and trends that connect the data to Earth’s energy budget.
- Explain why there is a relationship between the latitudinal trend of thawing surface soils and the seasonal change in the solar radiation received at the Earth’s surface.
- The Arctic region has a vast amount of mountainous terrain. Explain why the northern side of a mountain thaws later in the season than the southern side in these northernmost regions.
- Make predictions about Earth’s energy budget:
- Predict how the dataset will change if the freeze-thaw data was retrieved between May 1st and May 15th of the same year. Explain your reasoning.
- Predict how an extended thawing season in the Arctic may impact Earth’s energy budget. Explain your prediction.
Teacher Note
Data Clarifications:
- As liquid water freezes in soil, the water molecules become bound in a crystalline lattice, which changes how the incoming radar energy from SMAP interacts with Earth's surface, compared to soil containing freely oriented liquid water molecules.
- Note that permanently ice covered land surfaces such as Greenland are not part of this dataset.
- As noted by NASA/JPL, that the original data interpretation acknowledged The SMAP radar measurements indicate frozen soil conditions for some regions near the southern edge of the maps (in the United States and Eurasia), even though these regions are now thawed. This is a result of the influence of other characteristics of the land surface, such as soil moisture, on the radar signal.
Mini-Lesson Implementation Notes:
This mini-lesson requires that students have prior knowledge /understanding of the following:
- Use of latitude and longitude
- Reason for Earth’s seasons
- A prior introduction to Earth’s energy budget
- It may be helpful to clarify the expectations with students in terms of what it means to explain a relationship between variables which is required in the ”Exploratory Data Analysis”. In addition, you may need to rephrase or explain the ”Predictive Data Analysis” questions if students are unfamiliar with extending data interpretation beyond the dataset provided.
- If using this activity as a “warm-up”, use this dataset over three separate class periods and separate the analysis questions over the three days. Since they increase in level of difficulty, this allows students the opportunity to reinforce the descriptive and exploration analysis.
Teachers, these mini lessons/student activities are perfect "warm up" tasks that can be used as a hook, bell ringer, exit slip, etc. They take less than a class period to complete. Learn more on the "My NASA Data What are Mini Lessons?" page.
Teachers who are interested in receiving the answer key, please complete the Teacher Key Request and Verification Form. We verify that requestors are teachers prior to sending access to the answer keys as we’ve had many students try to pass as teachers to gain access.
Disciplinary Core Ideas:
- ESS2A: Earth Materials and Systems
Crosscutting Concepts:
- Cause and Effect
- Systems and System Models
Science and Engineering Practices:
- Asking Questions and Defining Problems
- Developing and Using Models
- Analyzing and Interpreting Data
Complementary Mini Lessons

Complementary Interactives


Document Resources
Grade Band
- 6-8
- 9-12
Time
- 30 minutes
Visualization Tool
NGSS Three Dimensional Learning
- See drop-down menu at the bottom of the page