Lesson Plans
Arctic Sea Ice Changes and Earth's Energy Budget
Overview
Students consider the impact of changing conditions on the remote island of Little Diomede, Alaska after they investigate the relationship between seasonal trends in sea ice extent with shortwave and longwave radiation flux described in Earth’s energy budget.
Materials Required
Procedure
Students will review information and analyze data sets to answer the questions.
Background information for students
- Review the information about Little Diomede.
- If the students have time, have them use Google Earth to explore the region. You can instruct them to copy and paste the following latitude and longitude: 65.7521649731741, -168.92505032501722
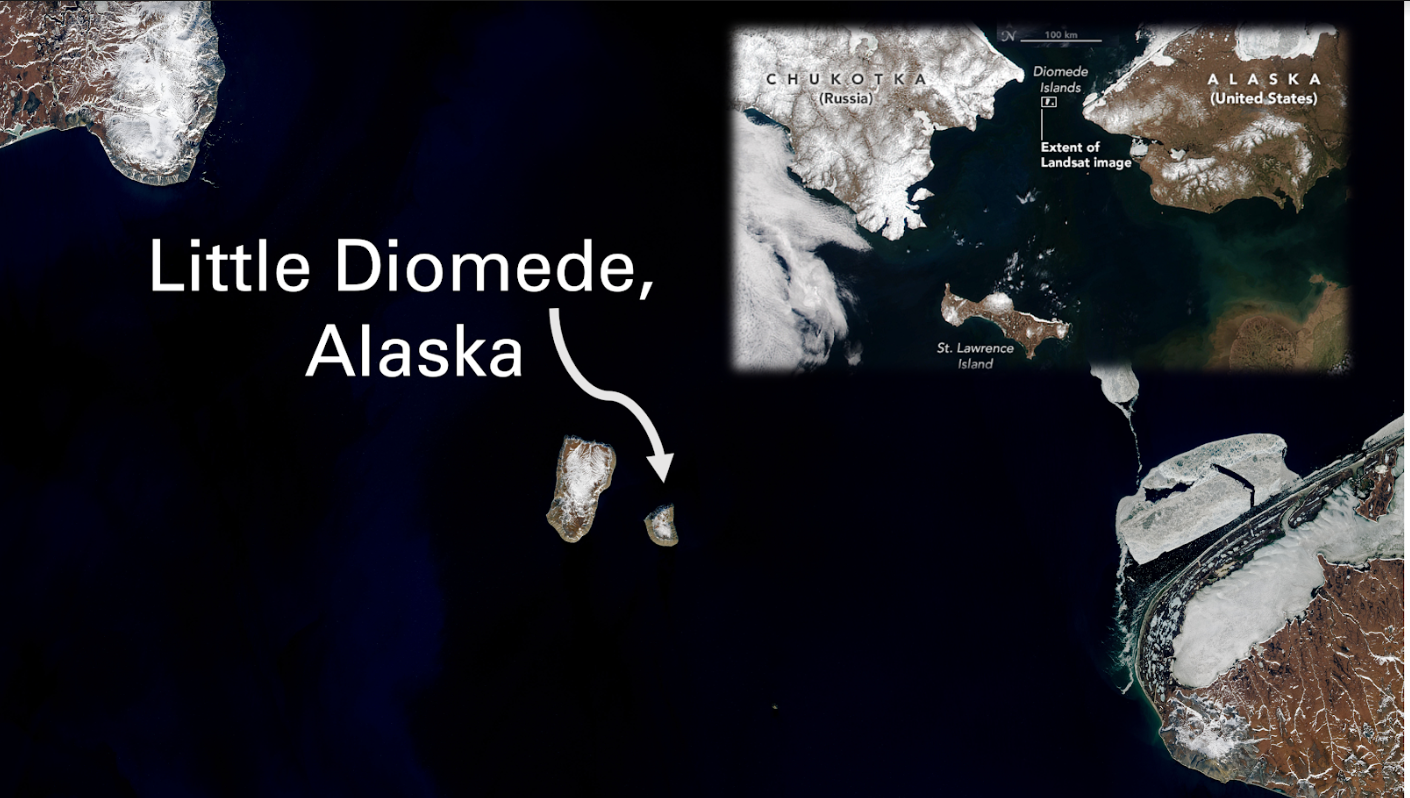
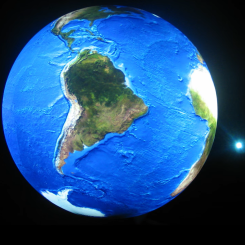
Where is Little Diomede?
The community of Little Diomede, Alaska (pronounced DIE-oh-meed), relies on sea ice for more than you would expect. In addition to hunters relying on the presence of sea ice needed as hunting grounds for important food sources; the citizens also use sea ice for their less publicized need of transportation on and off this remote island. Little Diomede is only 7.3km2 (2.8 miles2), most of it rocky, mountainous terrain. For the most part, the community is limited to a helipad for transportation on and off the island. Arctic living means that when the sea ice is thick enough, the local population can create a temporary runway for small planes to land. This in an important means of transporting goods and mail in and out for the residents.
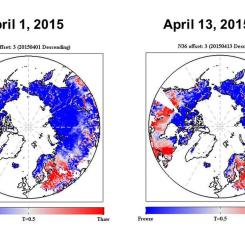
Trends in Sea Ice Extent
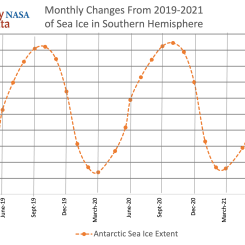
Below is a dataset retrieved from the shows the monthly changes in sea ice extent for the Northern Hemisphere. NASA and the National Snow and Ice Data Center in Boulder, Colorado, use satellites to observe sea ice extent. This is the area of ice that covers the Arctic Ocean at a given time. Sea ice forms in the cold winter months, when seawater freezes into massive blocks of floating ice, then partially melts away in the warm summer months. This cycle repeats every year. The data below demonstrates this seasonal trend.
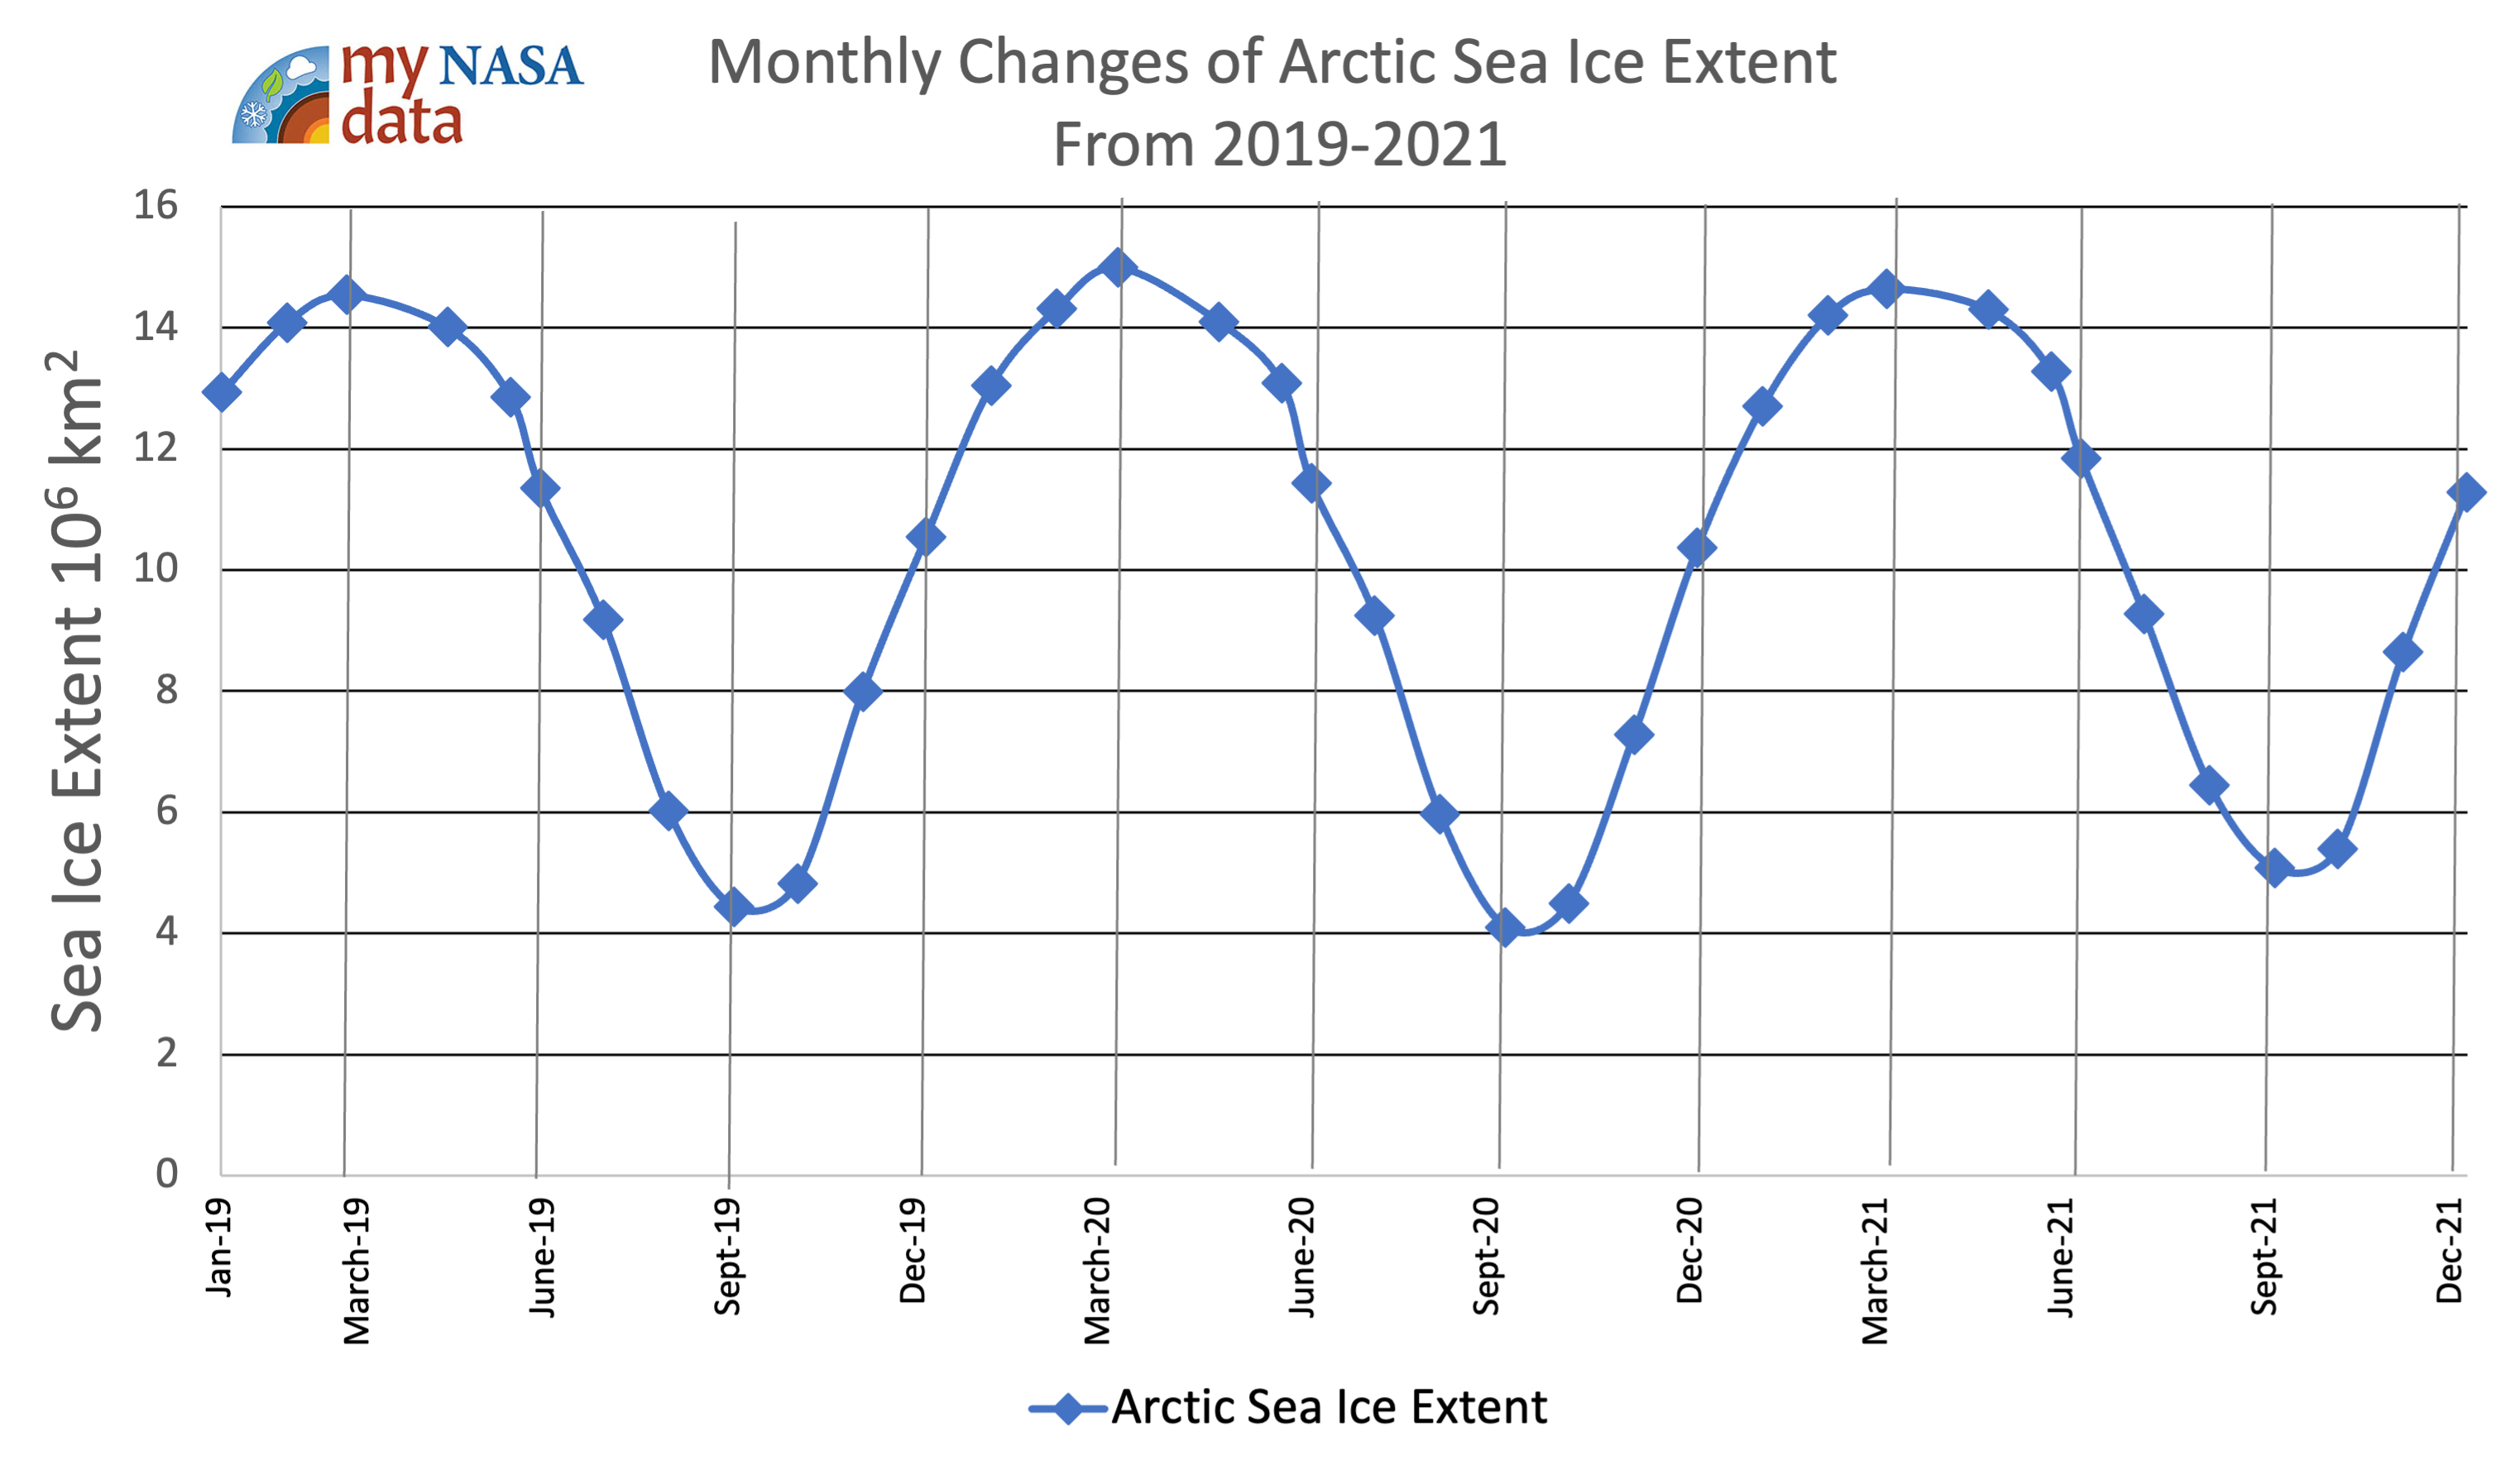
The sea ice minimum is the day, each year, when the sea ice extent is at its lowest. The sea ice maximum is the day each year when it is at its highest.
- Introduce the dataset to students and have them answer questions.
- Lead a class discussion - OR -
- Have students work individually or in groups to use the Arctic Sea Ice Changes and Earth's Energy Budget Student Sheets for their answers.
- Question Set # 1: Analyze the monthly changes in sea Ice extent using the graph above.
- Identify the range of sea ice extent measured during the monthly recorded sea ice minimum.
- Calculate the percent change in sea ice extent between the sea ice maximum and minimum during 2020.
- Identify the month of the year when Little Diomede will most likely have sea ice surrounding it?
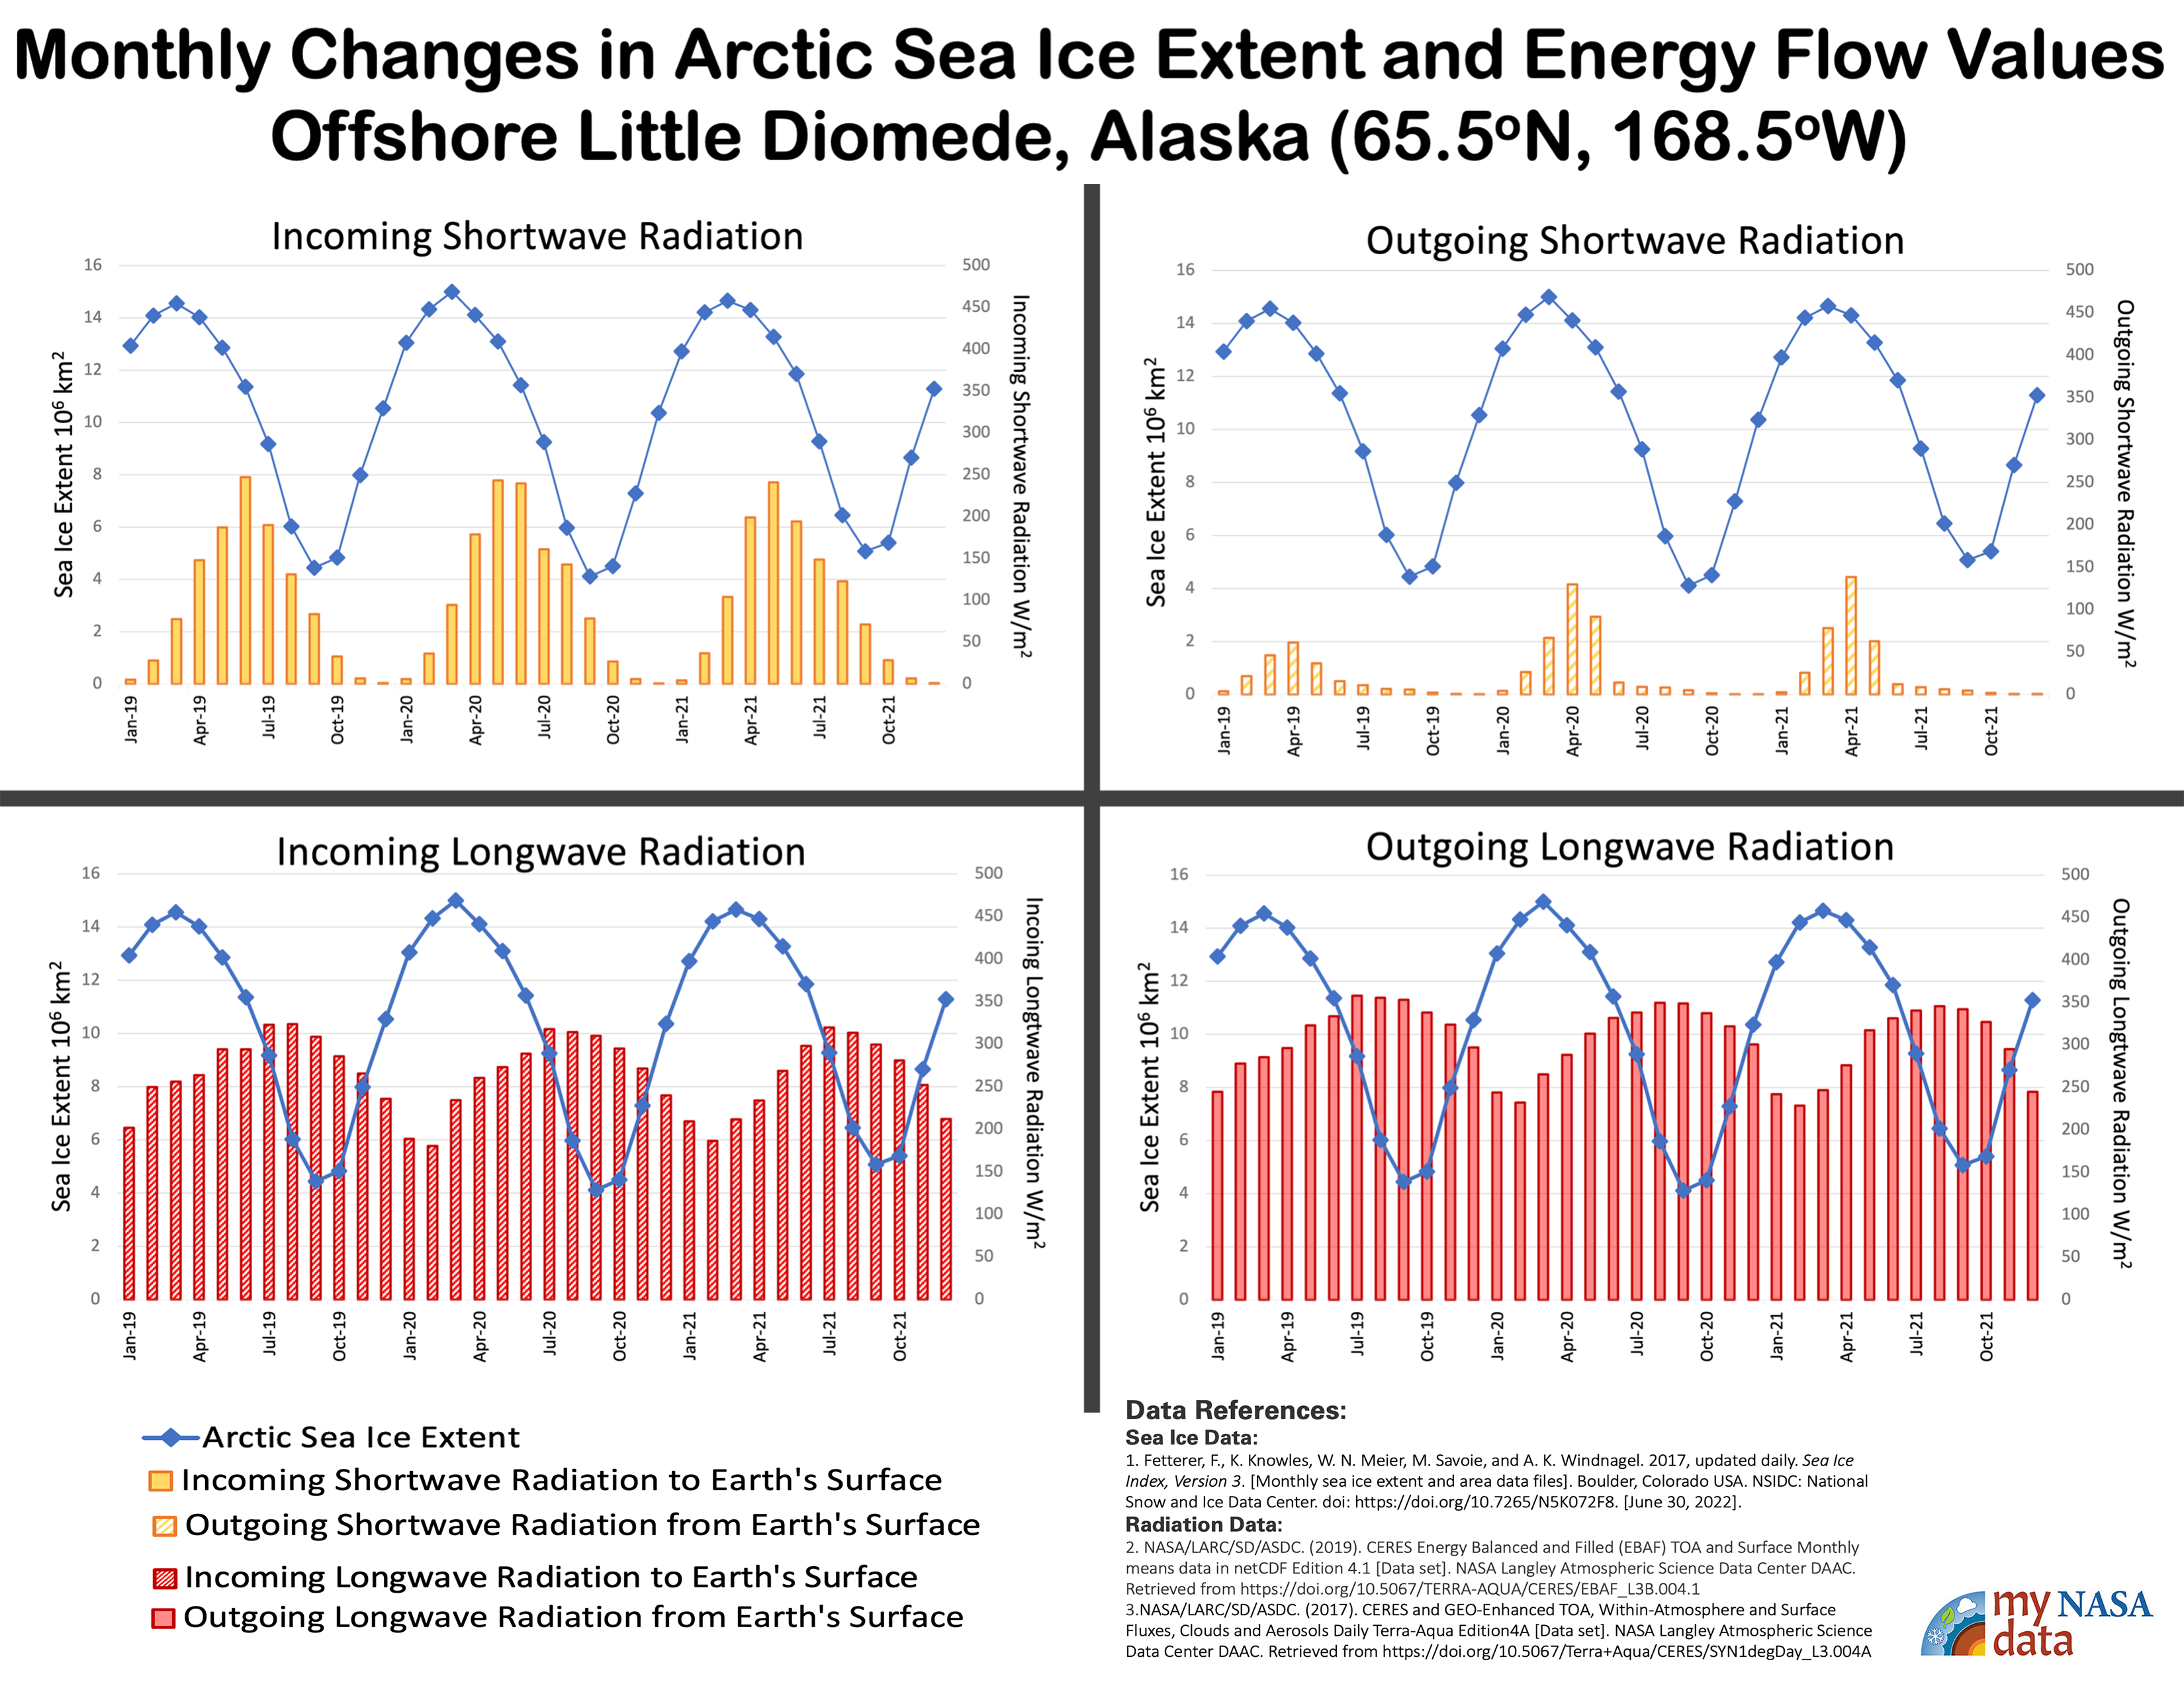
Relating Monthly Changes in Sea Ice Extent to Earth’s Energy Budget
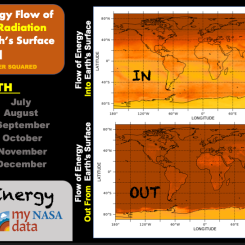
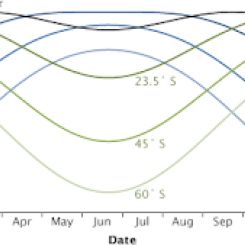
The following charts show column data along with on the sea ice extent line graph above. The four sets of data represent the energy flow into and out of Earth’s surface. Use your understanding of energy transfer in the Earth system to help explain the loss and gain of sea ice during the year.
- Introduce the graphs to students and have them answer questions.
- Lead a class discussion - OR -
- Have students work individually or in groups to use the Student Sheets for their answers.
-
Question Set # 2: Differentiate between shortwave and longwave radiation.
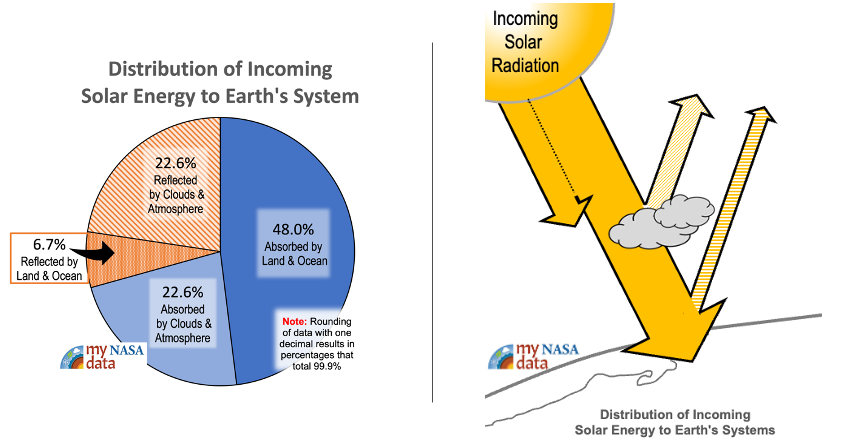
Remember: The term “shortwave” refers to the range of wavelengths of electromagnetic radiation peaking in the visible spectra that are attributed to solar energy that enters the Earth system. The term “longwave” refers to the range of wavelengths of electromagnetic radiation peaking in the infrared spectra that are attributed to energy released from the Earth’s surface.
- Incoming “shortwave radiation” is the term typically used to describe solar radiation. Explain how this type of radiation can come from Earth’s surface.
- Outgoing “longwave radiation” is the term typically used to describe terrestrial radiation. Explain how this type of radiation can come from Earth’s surface.
- Identify which arrows in the model below represent the energy transfer for each of the four data sets above.
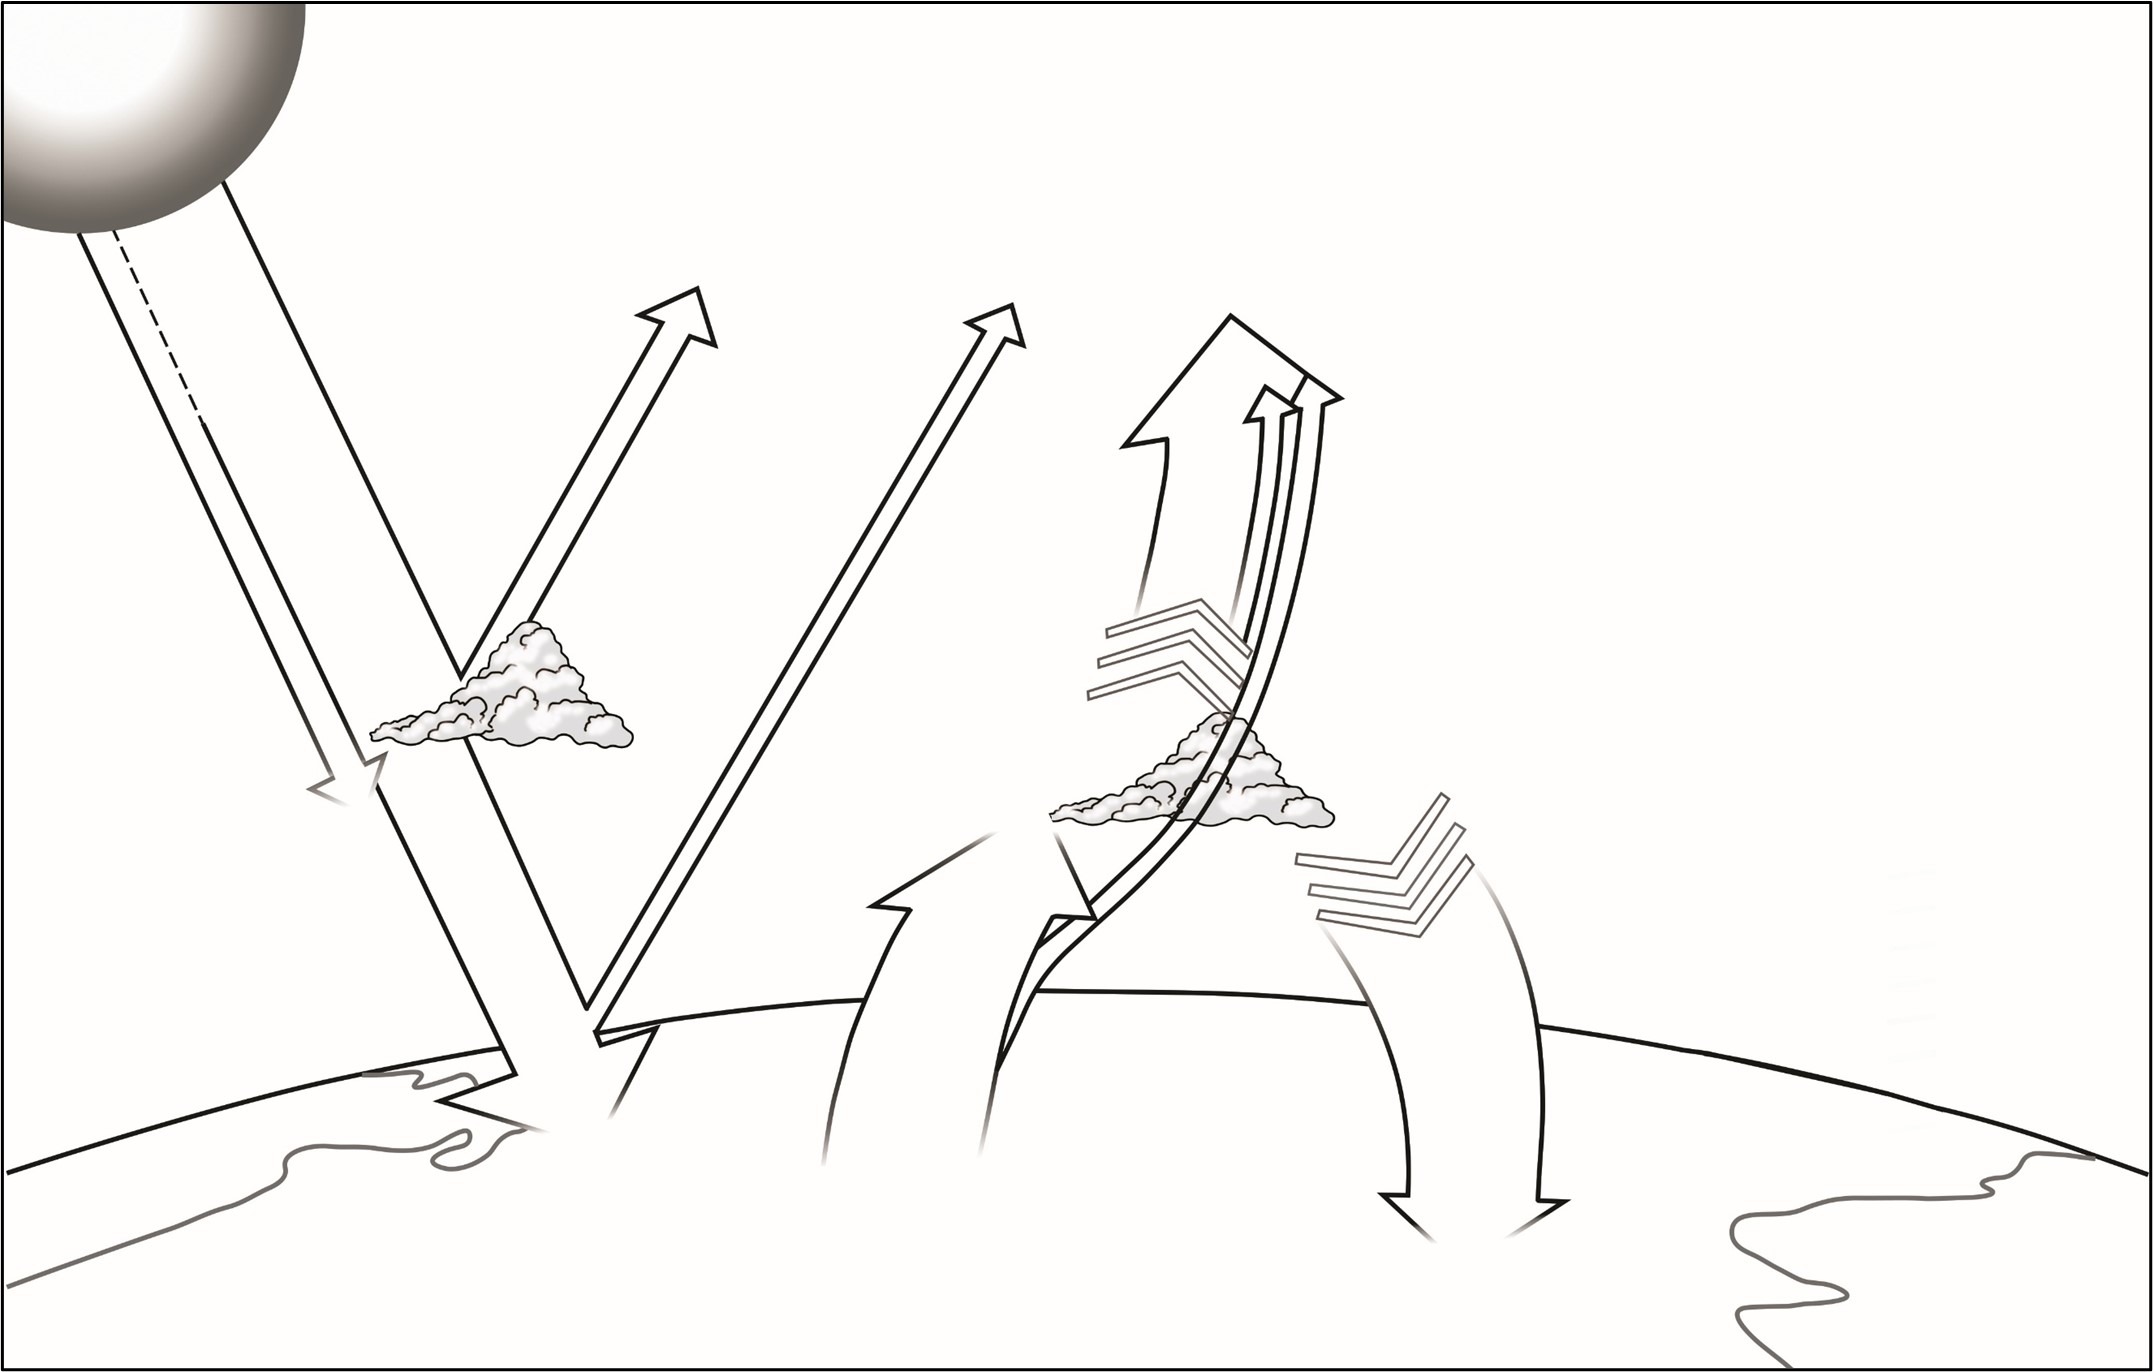
Earth Energy Budget Storyboard. Source: Image adapted from original model developed from Loeb et al., J. Clim. 2009 & Trenberth et al., BAMS, 2009 | https://mynasadata.larc.nasa.gov/sites/default/files/inline-images/EEB%20Diagram_0.jpg

Connect energy transfer in the Earth System to changing sea ice extent.
- Continue the lesson by having students answer question set 3.
-
Question Set # 3: Connect energy transfer in the Earth System to changing sea ice extent.
- Describe the relationship between shortwave radiation flowing in the Earth system and changes in sea ice extent in the Arctic.
- Describe the relationship between longwave radiation flowing in the Earth system and changes in sea ice extent in the Arctic.
- Discuss how both shortwave radiation and longwave radiation together drive the changes observed monthly in sea extent in the arctic region.
Consider the impact humans have on sea ice extent.
- Conclude the lesson by having students answer the last set of questions and reviewing student responses.
- Question Set # 4: Consider the impact humans have on sea ice extent.
- Identify one human activity that may ultimately affect the natural seasonal cycles of sea ice gain and loss.
- Explain the connection(s) that link the human activity you stated above with its’ effect on annual sea ice.
- Propose one realistic solution to reduce the anthropogenic impact you described above.
Answers:
Teachers who are interested in receiving the answer key, please complete the Teacher Key Request and Verification Form. We verify that requestors are teachers prior to sending access to the answer keys as we’ve had many students try to pass as teachers to gain access.
Sources:
- Hansen, K. (2018, January 26). Yesterday and Tomorrow Islands. NASA Earth Observatory. Retrieved September 22, 2022, from https://earthobservatory.nasa.gov/images/91638/yesterday-and-tomorrow-i…
- What is Earth's Energy Budget? Five Questions with a Guy Who Knows. (2017, April 10). NASA. Retrieved September 8, 2022, from https://www.nasa.gov/feature/langley/what-is-earth-s-energy-budget-five…
Disciplinary Core Ideas:
- ESS2A: Earth Materials and Systems
Crosscutting Concepts:
- Systems and System Models
Science and Engineering Practices:
- Developing and Using Models
What is the Earth's Energy Budget?
- Internet Required
- One-to-One (tablet, laptop, or CPU)
- Teacher computer/projector only
Complementary Lesson Plans

Grade Band
- 6-8
- 9-12
Time
- 30 minutes
Visualization Tool
NGSS Three Dimensional Learning
- See drop-down menu at the bottom of the page