Lesson Plans
Investigating Sea Ice Extent in the Arctic and Antarctic
Overview
Guided by the 5E model, this lesson allows students to work together to uncover how changes in sea ice extent in the Arctic and Antarctic regions are connected to Earth’s energy budget.
Materials Required
- Google Slides (Models Used to Analyze Sea Ice Extent for Teacher Display or Printed Graph Handouts)
- Investigating Sea Ice Extent in the Arctic and Antarctic - Student Sheets
- Optional : Sea Ice Extent Data - Graphing Monthly Trends
Procedure
Engage:
- Provide students with the Investigation Sea Ice in the Arctic and Antarctic Student Sheets before beginning this section.
- Engage prior knowledge of students’ spatial understanding of sea ice by asking them them where they expect to find sea ice in the summer and winter months.
- Prior to the next prediction, the teacher should correct any student misconceptions about sea ice (such as including area of land ice) and then define the term “sea ice extent”.
- Engage prior knowledge of students' ideas about how sea ice changes over the year.
- Predict on the map and/or graph how sea ice extent changes seasonally over the three years. Using the map, students should predict the change in latitudinal extent.
- Using the empty graph, students should draw a line to predict the trend is how sea ice extent changes throughout the year.
- Optional: The teacher may want to reveal the beginning value for Arctic in Jan 2019 of 12.9 km2 and for Antarctic in Jan 2019 of 5.3 km2 to assist with beginning this activity.
- Students should make their predictions on the empty graph that is on the Analyzing Sea Ice Student Handout.
- Students may share their responses and explore how their ideas differed.
Explore:
- Divide students into small teams (3-4 students).
- Lead a short discussion about sea ice topics to ensure students interpret the dataset correctly.
- Explain to students that sea ice is commonly measured in two ways using satellite imagery. Teachers: See the Teacher Background for an analogy using swiss cheese to address these differences.
- sea ice extent (a measurement of the ocean's sea ice including from the edges of the sea ice and all of the space inside)
- sea ice area (a measurement of the area of the ocean only covered by ice).
- Sea ice is frozen sea water that floats on the ocean. Land ice is formed from falling snow and becomes compacted year after year.
- The geography of the Arctic differs from the Antarctic, and as a result influences the gain and loss of seasonal ice. Arctic sea ice is confined to continental boundaries as opposed to Antarctic sea ice that expands and contracts around a continental boundary.
- Explain to students that sea ice is commonly measured in two ways using satellite imagery. Teachers: See the Teacher Background for an analogy using swiss cheese to address these differences.
- Distribute or share the 2019-2021 monthly graphed sea ice extent data for the northern and southern hemispheres electronically using the Models Used to Analyze Sea Ice Extent Slides or printed copies of slide show slides. (Note: black and white printable copies are acceptable).
-
Depending on class arrangement the teacher may choose to how to best distribute the separate graphs to different pairs in the team. Ultimately the pairs will share the information they retrieved from their graph with each other.
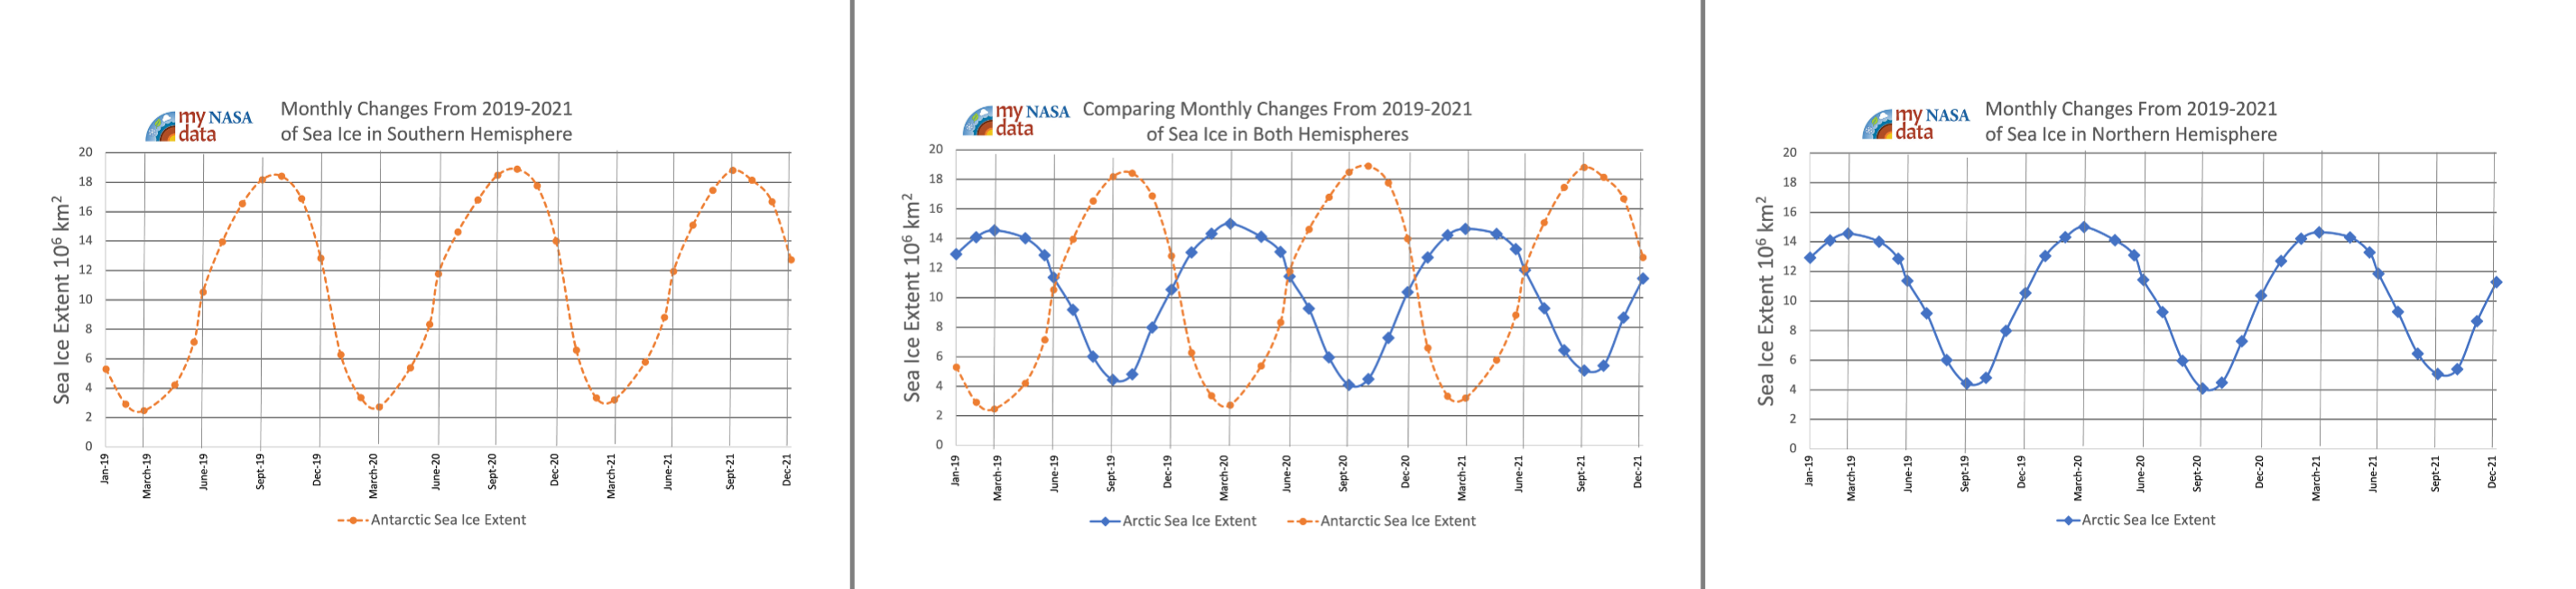
Three line graphs showing monthly changes in sea ice extent in the Northern Hemisphere, Southern Hemisphere and both combined. Source: My NASA Data | https://mynasadata.larc.nasa.gov/sites/default/files/inline-images/Sea%20Ice%20Graphs_1.png - Students may work individually or in pairs to respond to the questions labeled “Individual/Pair” on the Investigating Sea Ice Extent in the Arctic and Antarctic - Student Sheets.
- Conduct a class discussion to acknowledge/review student responses to ensure students are reading and interpreting the graphs correctly and lead a short discussion for students to correctly interpret the unit 106 km2.
- For reference you may want to find the area of your state ahead of time.
- The state closest in size to 1 million square kilometers is Texas at around 0.7 million square kilometers.
- Students pairs that analyzed the different hemisphere should come together to discuss response for the questions labeled “Team” on the Analyzing Sea Ice Student Handout.
- Review “Team” responses by asking each teams to share part of a response as part of a class discussion. This is an opportunity to clarify student interpretations of data.

Questions
Individual/Pair
- Identify the unit used to measure sea ice extent.
- Identify the maximum sea ice extent in the Northern/Southern Hemisphere shown on the graph.
- Identify the minimum sea ice extent in the Northern/Southern Hemisphere shown on the graph.
- Describe the changes in sea ice extent in the Northern/Southern Hemisphere during the year 2020.
Team
- Identify three specific characteristic of the sea ice extent in the Southern Hemisphere that represent a distinctly different trend then what is observed in the Northern Hemisphere.
- Identify one prediction that can be made about sea ice extent using the data provided.
Explain:
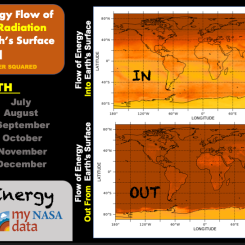
- Students work in pairs or teams to use the orbital model shown below to attribute monthly changes in sea ice extent with seasonal variations in energy flow at Earth surface at different latitudes. They complete a table to organize their ideas that explain these changes.
-
Teacher reviews the information/content with students to ensure that they understand the cause and effect relationship between the angle of incidence of incoming solar radiation and the amount of energy that travels to the Earth’s surface during specific times of year depending on latitude.
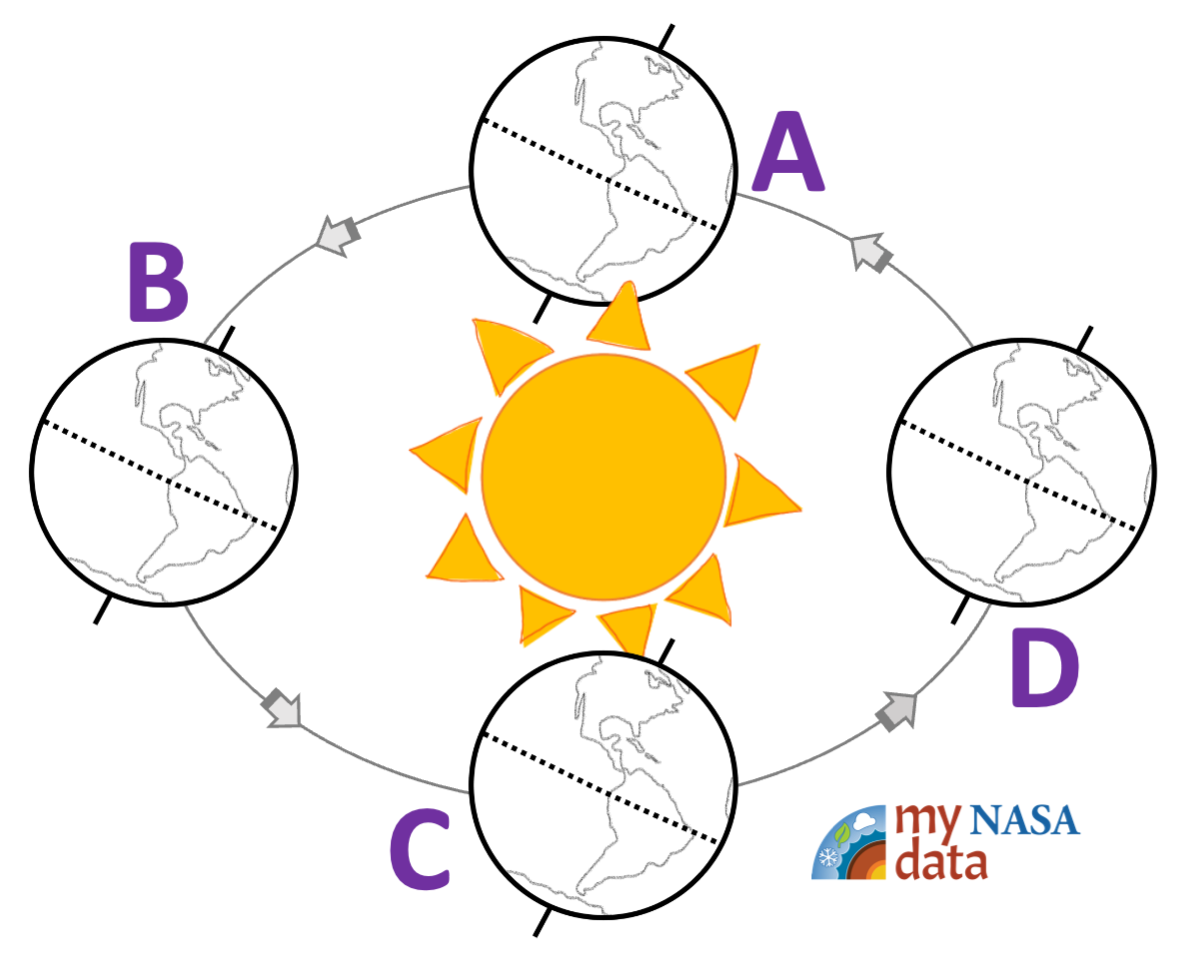
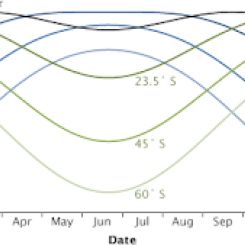
Model of Earth’s solar orbit showing labeled seasonal positions. Source: My NASA Data | https://mynasadata.larc.nasa.gov/sites/default/files/inline-images/Seasons_MNDLogo.png Note: The orbital model “A” is spring as opposed to the graphs that start with a winter month.
Question Prompt:
Relate the sea ice data to a model showing seasonal positions of Earth’s solar orbit. Explain why seasons are connected to changes in sea ice extent.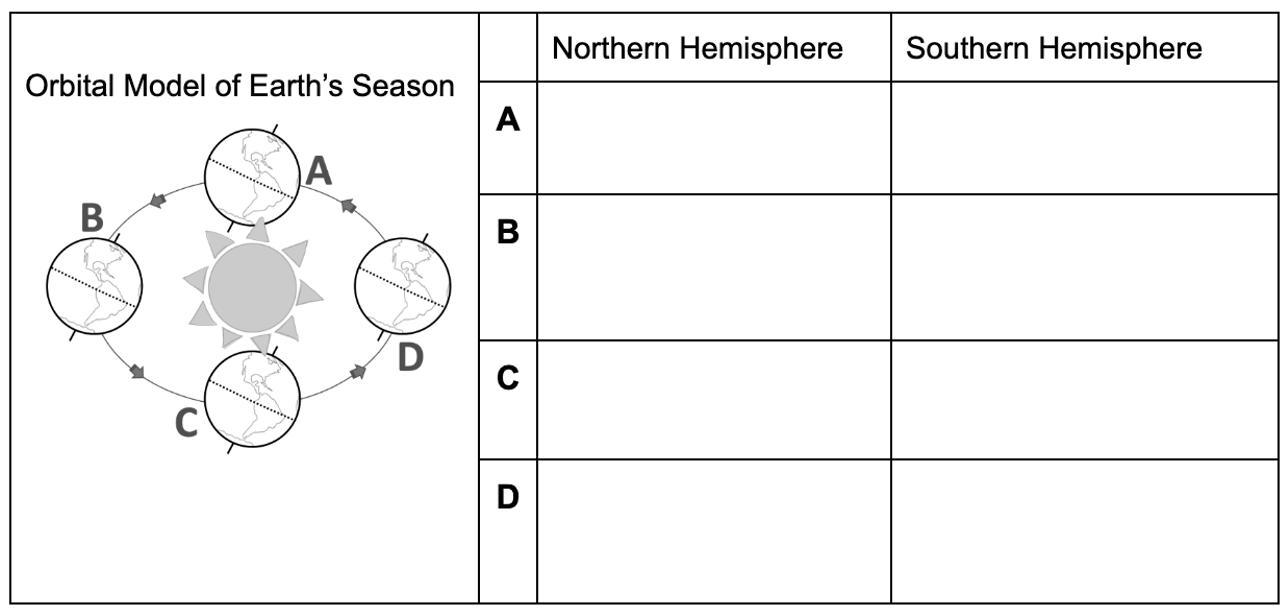
- Once the class has agreed on explanations appropriate for each location, lead a discussion to extend their understanding of the influence of Earth’s axis tilt of 23.5 degrees. Students discuss and respond to the question; Explain how the Sea Ice Extent for the Northern and Southern Hemisphere would be different given the following conditions :
- Earth is at LOCATION B in the orbital model above.
- Earth’s axis is tilted in the same direction, but only at 10 degrees.


Elaborate:
-
Ask students to close their eyes and pretend they have an ice cube in each hand as you read the following dialogue. Student should just listen and use the words to create a scenario that helps them think about what happens when ice melts. They should not respond to the questions in the dialogue.
Melting Ice Story
Your palms are face up and open. I put an ice cube in each hand. Think about how the ice cube feels. Why does it feel that way? Now I escort you with your ice outside on a nice sunny day. What changes with the melting ice? You decide you will try and protect on of the cubes from the sun’s rays by making a fist around it. Did that help? Now we walk back inside. Open your palms and look at your ice cubes. How is the melting different now? Are both ice cubes melting as the same rate in your open palm as they were before we left the building to go out in the sun? Finally your ice cube has melted away. Did one of them melt before the other? Time to dry off your hands and work with your team to think about what causes sea ice to melt.
Note: Instead of using the classroom dialogue, students may conduct a lab and/or participate in a demonstration. Information about these options are provided below.
- Students work together in their teams to answer a question set that was developed to help elicit their understanding of heat transfer to explain the timing of the sea ice maximum and sea ice minimum. Students should be able to extend their understanding of heat transfer beyond the source of energy being solar radiation and now describe the Earth itself as a source of energy that causes sea ice to melt.
- When you hold an ice cube in the palm of your hand in the sun describe the energy transfer that causes the the ice to melt.
- When you hold an ice cube in the palm of your hand in the dark describe the energy transfer that causes the the ice to melt.
- Use your understanding about heat transfer between Earth systems to explain why the month you identified previously as the sea ice minimum is not the same time as the summer solstice when incoming solar radiation is at its’ greatest.
- Repeat your understanding to contrast the timing of the sea ice minimum and the winter solstice.
- Compare the energy transfer involved in the melting of sea ice to simply holding a piece of ice in your hand by identifying one way they are similar and identifying two ways they are different.
Alternatives to Dialogue:
- Conduct the Classroom Lab described in the “Melting Ice Experiment”
- Students participate in the following demonstration and collect evidence.
- Provide students with an ice cube to hold and ask one hold the ice cube in their open palm under a heat lamp (mimicking the sun) and the other hold an ice cube in a closed palm away from the heat lamp. Students should note how much each ice cube melted and discuss how the energy was transferred to the ice to cause melting in each situation.
- (Safety concerns: Use caution with heat lamps and ensure students are holding the ice cube at a safe distance from energy source.)
Evaluate:
-
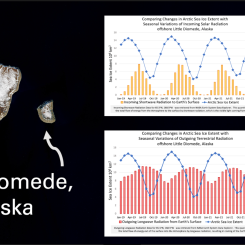
Distribute the graph of Long term Sea Ice Trends to students.
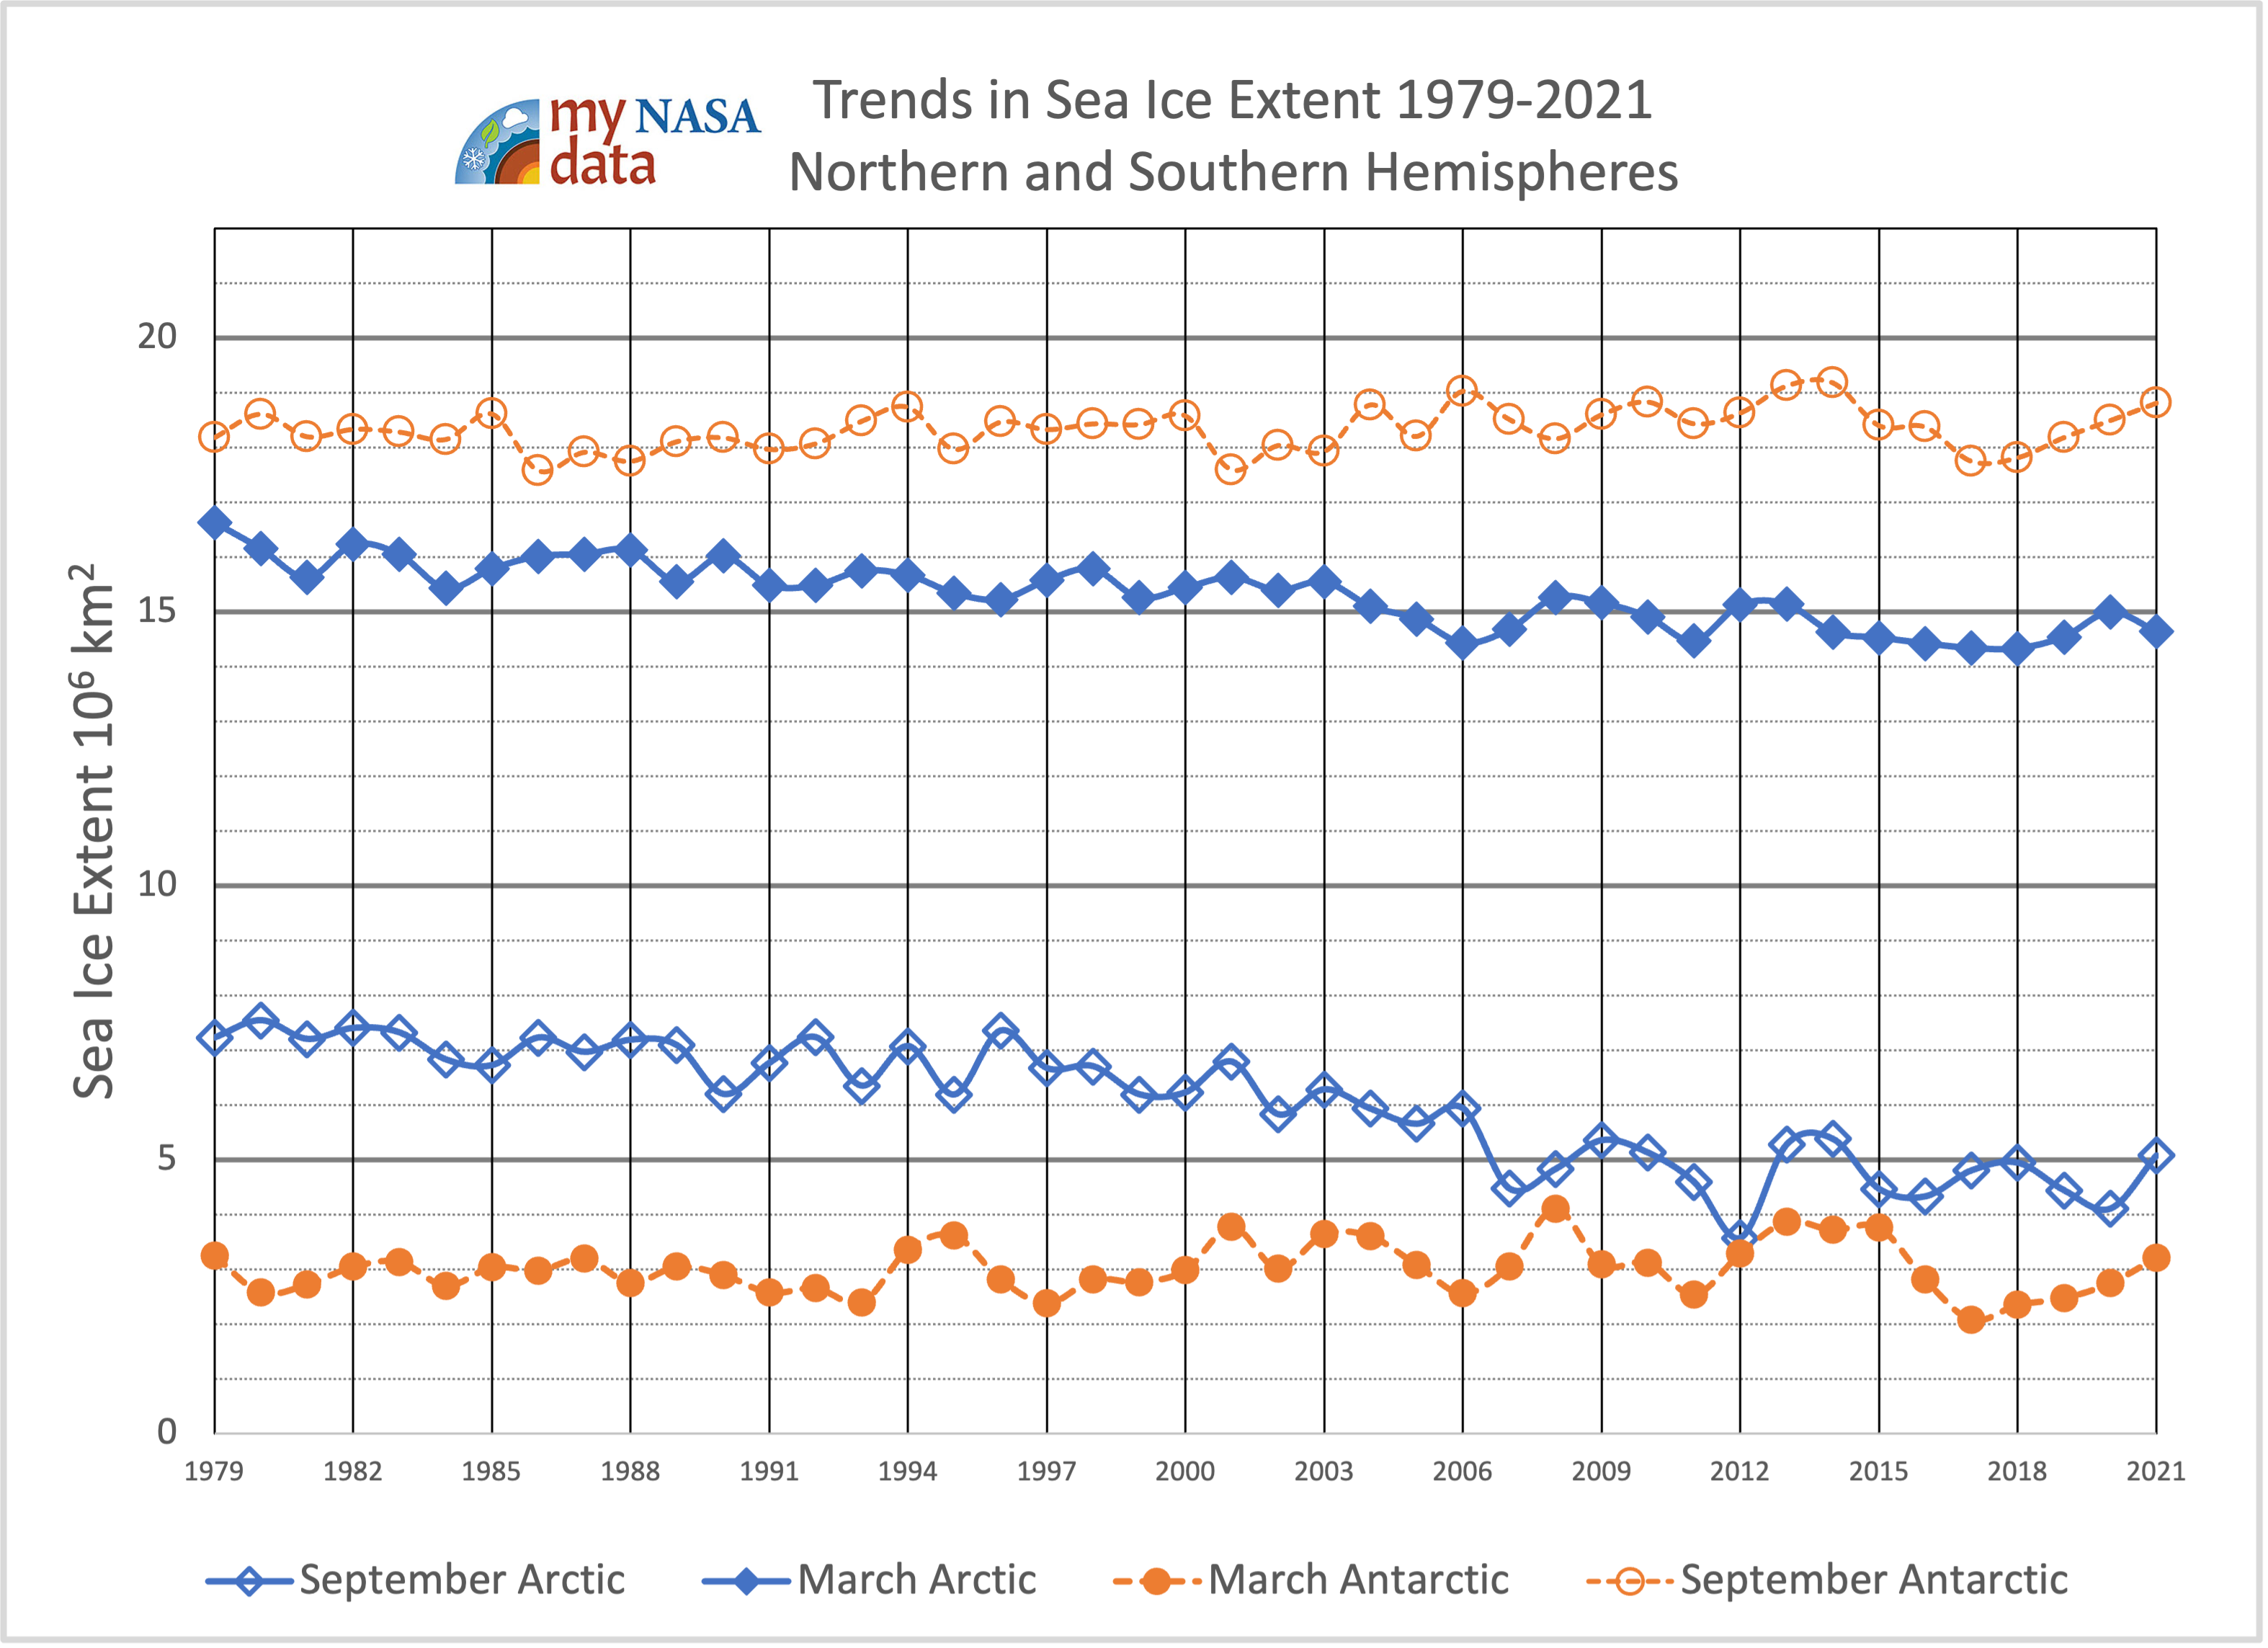
Time-series graph showing sea ice changes in both the Arctica and Antarctic from 1979 until 2021. Source: My NASA Data | https://mynasadata.larc.nasa.gov/sites/default/files/inline-images/Longterm%20Sea%20Ice%20Trends_0.png - Assess the depth of student understanding about energy transfer in the Earth system and its’ connection to changes in sea ice extent over time.
- Students respond to the following questions:

Students demonstrate understanding by analyzing a graph of long-term sea ice trends.
Evaluation Questions:
- Identify specific evidence that supports the claim that sea ice in the Arctic is melting faster than the Antarctic.
- Explain the differences in seasonal sea ice extent (March vs September) between the Arctic (Northern Hemisphere) and Antarctic (Southern Hemisphere).
- Make a prediction about how the long-term Arctic and Antarctic sea ice extent would change if the Earth was not tilted at 23.5o, but instead the polar axis was perpendicular to the sun. Explain your prediction.
- Describe how the long-term change in sea ice in the Northern Hemisphere differs from the long-term change observed in the Southern Hemisphere.
- According to NASA’s Vital Signs of the Planet, “The amount of solar energy that Earth receives has followed the Sun’s natural 11-year cycle of small ups and downs with no net increase since the 1950s.” Discuss how changes in energy in the Earth system can explain the long-term change in sea ice extent if it can’t be attributed to changes of incoming solar radiation.
- Optional: have students access information from the “Ask NASA Climate” website to explore more about the differences in long-term trends in Arctic and Antarctic sea ice as well as other factors that influence sea ice extent such as winds and aerosols.
Answers:
Teachers who are interested in receiving the answer key, please complete the Teacher Key Request and Verification Form. We verify that requestors are teachers prior to sending access to the answer keys as we’ve had many students try to pass as teachers to gain access.
Sources:
- Fetterer, F., K. Knowles, W. N. Meier, M. Savoie, and A. K. Windnagel. 2017, updated daily. Sea Ice Index, Version 3. [Monthly sea ice extent and area data files]. Boulder, Colorado USA. NSIDC: National Snow and Ice Data Center. doi: https://doi.org/10.7265/N5K072F8. [June 30, 2022].
- Launchpad: ICESat-2 - Next Generation Technology. (2013, August 14). YouTube. Retrieved September 20, 2022, from https://www.youtube.com/watch?v=g3qmgopJt_8
- NASA's Earth Minute: Greenland Ice. (2015, August 28). YouTube. Retrieved September 20, 2022, from https://www.youtube.com/watch?v=yLm7PSsvW8g
- NASA | Earth Science Week | How is the Global Earth ... (2008, October 16). YouTube. Retrieved September 20, 2022, from https://www.youtube.com/watch?v=tXnOGEEVtjQ
- Gold, A. (2021, October 18). Five Facts to Help You Understand Sea Ice. NASA. Retrieved September 20, 2022, from https://www.nasa.gov/feature/esnt/2021/five-facts-to-help-you-understan…
- Arctic and Antarctic Sea Ice: How Are They Different? – Climate Change: Vital Signs of the Planet. (2019, April 10). NASA Climate Change. Retrieved September 20, 2022, from https://climate.nasa.gov/ask-nasa-climate/2861/arctic-and-antarctic-sea…
- Causes | Facts – Climate Change: Vital Signs of the Planet. (n.d.). NASA Climate Change. Retrieved September 20, 2022, from https://climate.nasa.gov/causes/
- Educator Guide: Melting Ice Experiment. Retrieved September 20, 2022, from https://www.jpl.nasa.gov/edu/teach/activity/melting-ice-experiment/
- Frequently Asked Questions on Arctic sea ice | Arctic Sea Ice News and Analysis. National Snow and Ice Data Center. Retrieved September 20, 2022, from http://nsidc.org/arcticseaicenews/faq/#area_extent
Disciplinary Core Ideas:
- ESS2A: Earth Materials and Systems
Crosscutting Concepts:
Science and Engineering Practices:
- Students will use a graph model to identify data as evidence to support their claim about changes in sea ice extent.
- Students will recognize and explain seasonal differences in sea ice extent at the poles.
- Students will apply heat transfer concepts to explain changes in sea ice extent.
- Why is it important to monitor the extent of sea ice over time?
- What are the ecosystem services (benefits it provides to people) of polar sea ice?
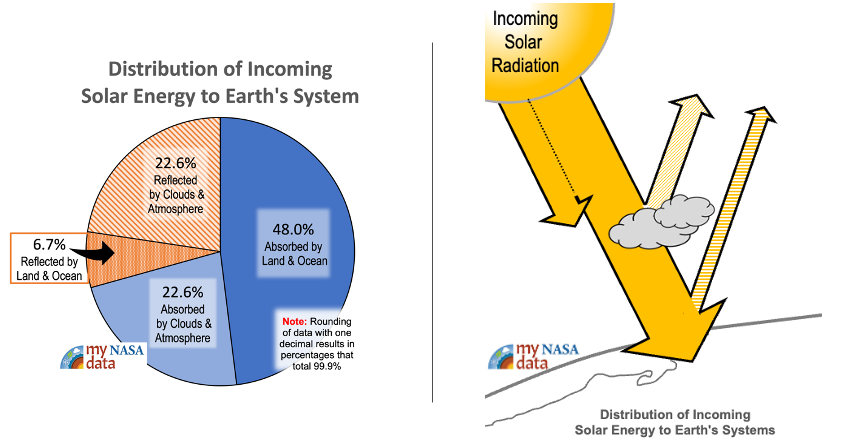
- How is sea ice connected to Earth’s energy budget?
What is the difference between sea ice area and extent?
(Credit: Frequently Asked Questions on Arctic sea ice)
Area and extent are different measures and give scientists slightly different information. Extent is always a larger number than area, and there are pros and cons associated with each method.
A simplified way to think of extent versus area is to imagine a slice of swiss cheese. Extent would be a measure of the edges of the slice of cheese and all of the space inside it. Area would be the measure of where there is cheese only, not including the holes. That is why if you compare the extent and area in the same time period, the extent is always bigger. A more precise explanation of extent versus area gets more complicated.
Extent defines a region as “ice-covered” or “not ice-covered.” For each satellite data cell, the cell is said to either have ice or to have no ice, based on a threshold. The most common threshold (and the one NSIDC uses) is 15 percent, meaning that if the data cell has greater than 15 percent ice concentration, the cell is considered ice covered; less than that and it is said to be ice free. Example: Let’s say you have three 25 kilometer (km) x 25 km (16 miles x 16 miles) grid cells covered by 16% ice, 2% ice, and 90% ice. Two of the three cells would be considered “ice covered,” or 100% ice. Multiply the grid cell area by 100% sea ice and you would get a total extent of 1,250 square km (482 square miles).
Area takes the percentages of sea ice within data cells and adds them up to report how much of the Arctic is covered by ice; area typically uses a threshold of 15%. So in the same example, with three 25 km x 25 km (16 miles x 16 miles) grid cells of 16% ice, 2% ice, and 90% ice, multiply the grid cell areas that are over the 15% threshold by the percent of sea ice in those grid cells, and add it up. You would have a total area of 662 square km (255.8 square miles).
Scientists at NSIDC report extent because they are cautious about summertime values of ice concentration and area taken from satellite sensors. To the sensor, surface melt appears to be open water rather than water on top of sea ice. So, while reliable for measuring area most of the year, the microwave sensor is prone to underestimating the actual ice concentration and area when the surface is melting. To account for that potential inaccuracy, NSIDC scientists rely primarily on extent when analyzing melt-season conditions and reporting them to the public. That said, analyzing ice area is still quite valuable. Given the right circumstances, background knowledge, and scientific information on current conditions, it can provide an excellent sense of how much ice there really is “on the ground.”
Seasonal Predictions
When students predict the seasonal effects on sea ice, they should realize that the ice melts and shrinks in the summer and freezes and grows in the winter. They will likely set their minimum sea ice values somewhere around the summer months, and their predicted maximum values should be somewhere around the winter. In the Arctic, the yearly maximum generally occurs towards the end of winter or early spring, usually in March. The maximum is not in the middle of winter, when the temperatures are coldest. The ice pack continues to grow throughout the winter, thus reaching its maximum extent late in the winter season. When making predictions (hypotheses) about Antarctic sea ice extent on a monthly basis, many students may not take into account (or may not understand) the differences in seasons between the Northern and Southern Hemispheres. This can provide you with a very "teachable moment", and a great opportunity to discuss the cause of the seasons (the Earth's axial tilt, NOT variations in Earth's distance from the Sun; if the latter was the cause, both hemispheres should have the same seasons).
Water's property of thermal inertia also plays an important role. The Arctic Ocean does not cool down as quickly as does the air in the Arctic. Most students probably will not take these factors into account when they make their predictions, and may thus predict that the sea ice maximum occurs in December, January, or February. If some perceptive students do take this lag into account in their predictions, it would be good to call upon them to explain their predictions to the rest of the class. If none of your students take this lag into account when forming their hypotheses, make sure to point out the discrepancy between their predictions and the plot of actual data. Lead the students through a discussion of this lag and the causes of it. Likewise, their predictions for the time of minimum sea ice extent may be sometime in the middle of the summer, instead of the actual minimum which usually occurs in September. In a manner similar to the winter "lag", the summer temperatures, though highest in mid-summer, remain above freezing throughout the summer and into early fall, so the sea ice continues to melt and its extent continues to shrink. Also, the Arctic Ocean, which warms throughout the summer, holds its heat longer than does the atmosphere into the cooling autumn.
There are substantial differences between the Arctic and Antarctic that influence the extent of sea ice packs in the two opposite polar regions. The central portion of the Arctic is all ocean, whereas Antarctica has a continent in the middle. The sea ice area in the Arctic includes the area closest to the pole, while the sea ice area in the Antarctic is just the fringes around the edge of the continent and doesn't include the coldest region in the "center" nearest the South Pole. Also, the heat retention properties of a large landmass and huge ice sheet (in Antarctica) are very different than those of a large body of water (the Arctic Ocean). The net effects of these differences are not straightforward but can be used as discussion points with your class.
Status of Sea Ice Extent
Arctic sea ice extent is declining while permafrost is warming and thawing over parts of the Arctic. Some of these changes, such as the replacement of white reflective sea ice with dark open water, are set in motion feedbacks that contribute to even further warming. As the Arctic warms, some animal species are finding the region more hospitable, while others are seeing declines in their habitat. The Arctic region is becoming imbalanced, with ramifications for the rest of the hemisphere.
The Greenland and Antarctic ice sheets have decreased in mass. Data from NASA's Gravity Recovery and Climate Experiment show Greenland lost 150 to 250 cubic kilometers (36 to 60 cubic miles) of ice per year between 2002 and 2006, while Antarctica lost about 152 cubic kilometers (36 cubic miles) of ice between 2002 and 2005. Both the extent and thickness of Arctic sea ice has declined rapidly over the last several decades.
- Cause of Earth’s seasons
- Seasonal variations in Northern and Southern Hemisphere
- The difference between land ice and sea ice
- Vocabulary and explanations for energy transfer in the Earth system.
- The phenomenon of the seasons is caused by Earth's axial tilt, NOT variations in Earth's distance from the Sun; if the latter was the cause, both hemispheres should have the same seasons.
- Students often don’t distinguish between sea ice and land ice. Sea ice measurements do not include land ice.
- Melting sea ice is responsible for sea level to rise.
NASA and the National Snow and Ice Data Center in Boulder, Colorado, use satellites to observe sea ice extent. Over the past several decades, Arctic sea ice extent has been steeply declining year-round, especially in late summer when it reaches its minimum for the year. Sea ice forms in the cold winter months, when seawater freezes into massive blocks of floating ice, then partially melts away in the warm summer months. This cycle repeats every year.
Here are five facts about Arctic sea ice.
- Sea Ice Extent is Declining
- Sea Ice Helps Prevent Atmospheric Warming
- Sea Ice Affects Arctic Wildlife Above and Below Water
- Sea Ice Melt Does Not Greatly Contribute to Sea Level Rise
- Satellites Allow NASA to Monitor Sea Ice
Learn more about sea ice from NASA here.
- Students practice making a Time-series graph using the 2019-2021 monthly data for sea ice extent, available in the Google Sheet entitled, Sea Ice Extent Data - Graphing Monthly Trends.
- Learn how the second generation of the Ice, Cloud, and Land Elevation Satellite, better known as ICESat-2, is being used to map the ice structures in the world's polar regions. Manipulating the distribution of photons by lasers to create accurate images of these frozen structures allows scientists to study their changes and impact on Earth's climate.
The creation of ICESat-2 is allowing NASA's scientists to make accurate maps of polar ice sheets. These maps help them make informed predictions about weather patterns, climate change, and the effects of changing ice structures. The maps are so accurate they can measure to within 3 centimeters of an ice sheet's actual thickness from a huge distance!
- Standalone Lesson (no technology required)
- Internet Required
- One-to-One (tablet, laptop, or CPU)
- One-to-a-Group
- Teacher computer/projector only
Complementary Lesson Plans
Complementary Mini Lessons


Interactive Files
Grade Band
- 6-8
- 9-12
Time
- 50 minutes
Visualization Tool
NGSS Three Dimensional Learning
- See drop-down menu at the bottom of the page