Mini Lesson/Activity
Exploring Seasonal Chlorophyll Concentrations
Overview
Students will analyze the monthly seasonal chlorophyll concentration images in our global oceans for the four different months of 2017, and then answer the following questions.
Student Directions
Background:
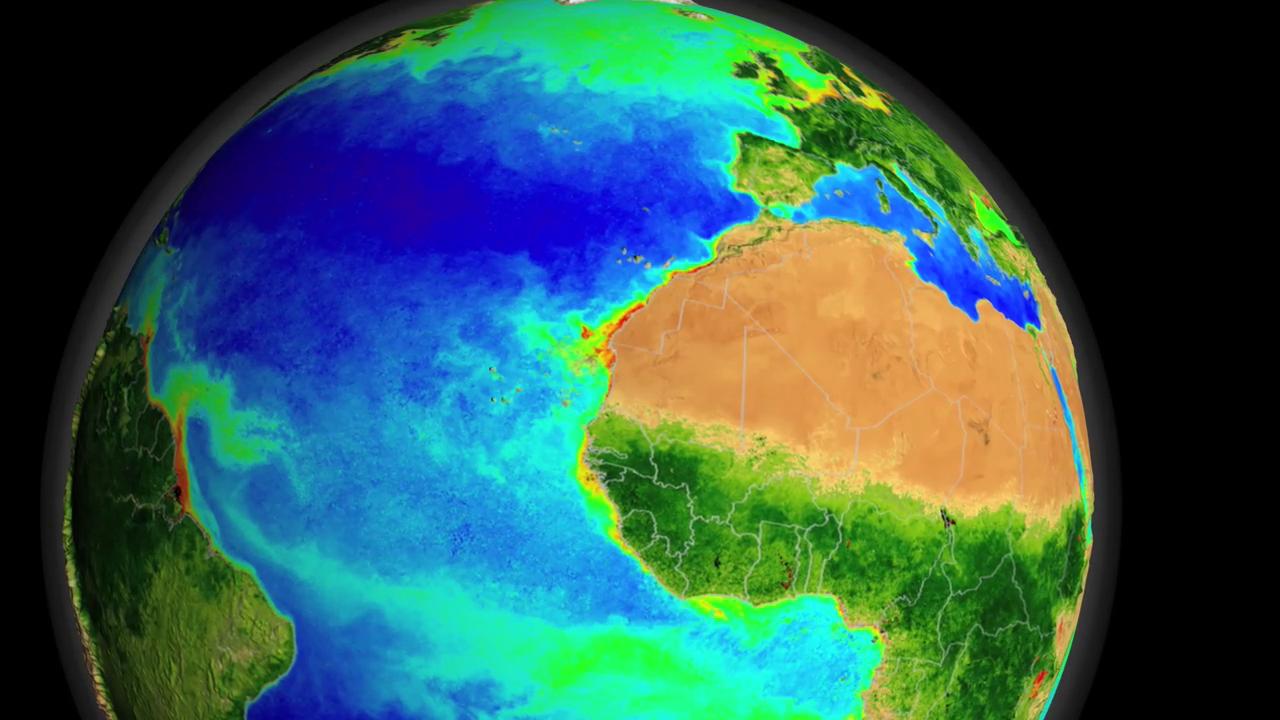
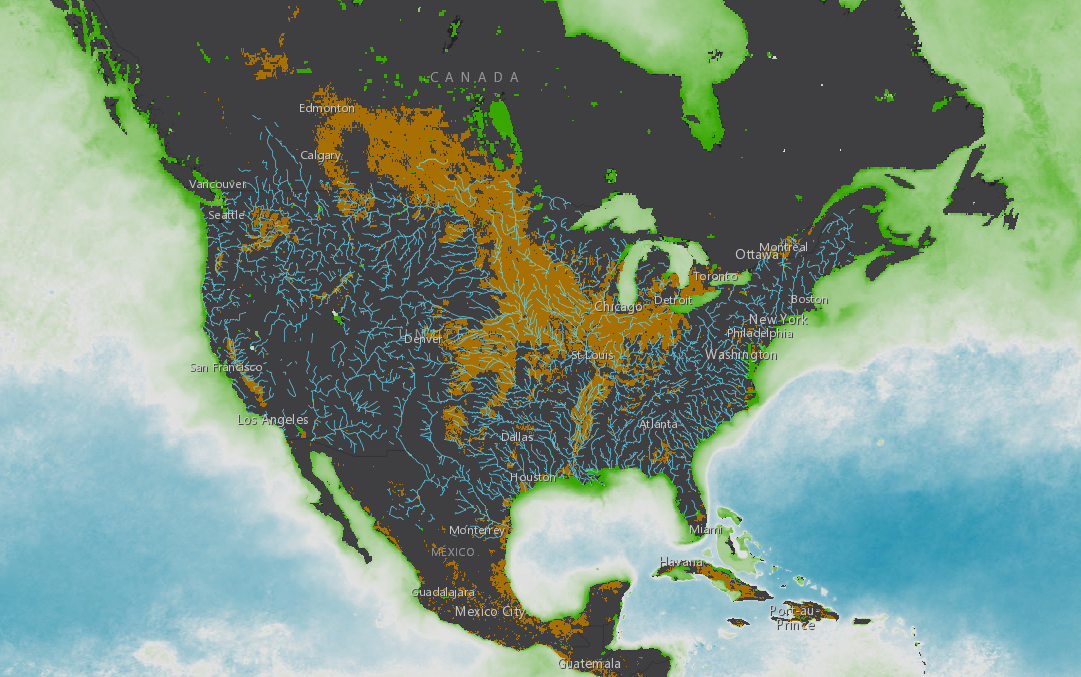
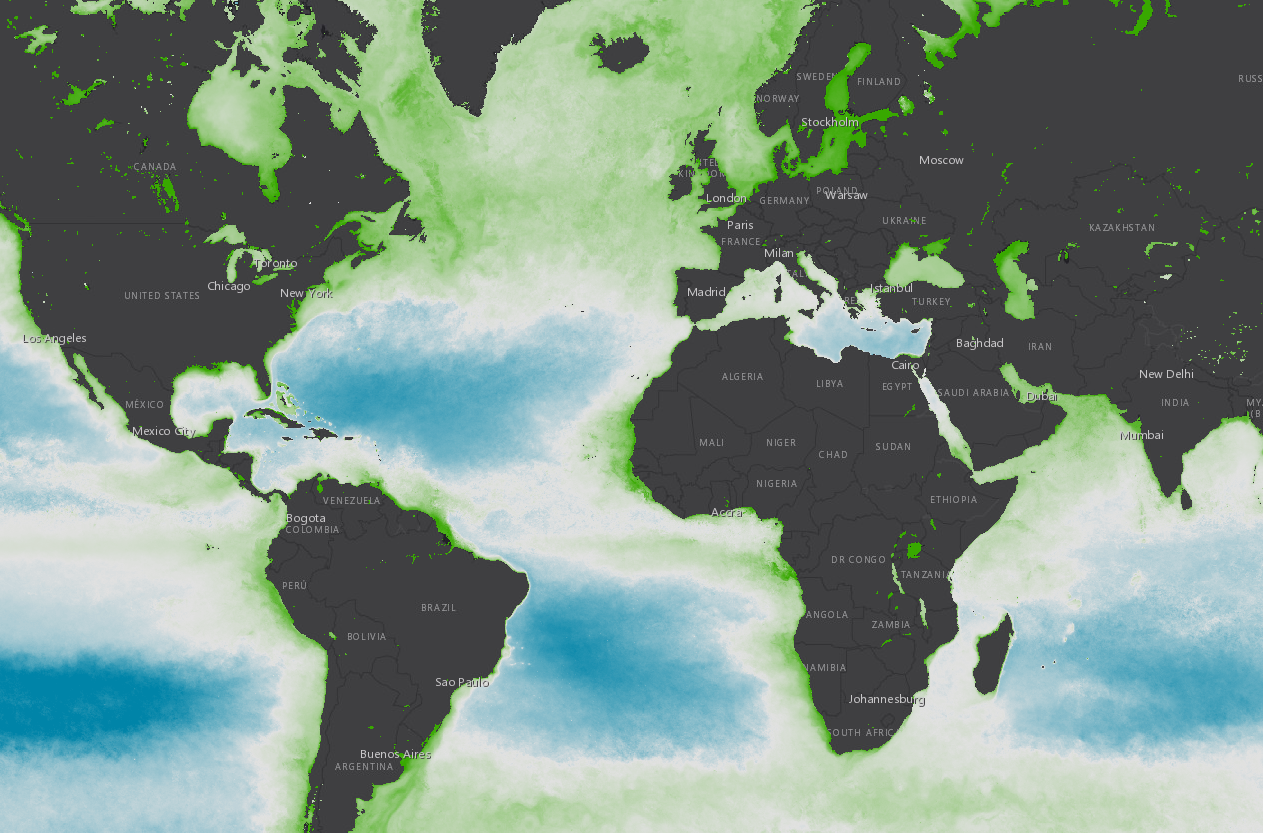
Phytoplankton are microscopic, floating, plant-like organisms that live in oceans, lakes, and rivers. They use photosynthetic pigments (like chlorophyll) to convert energy from the Sun into organic matter. For this reason, NASA satellites can observe the amount of phytoplankton in the ocean by measuring chlorophyll concentrations.
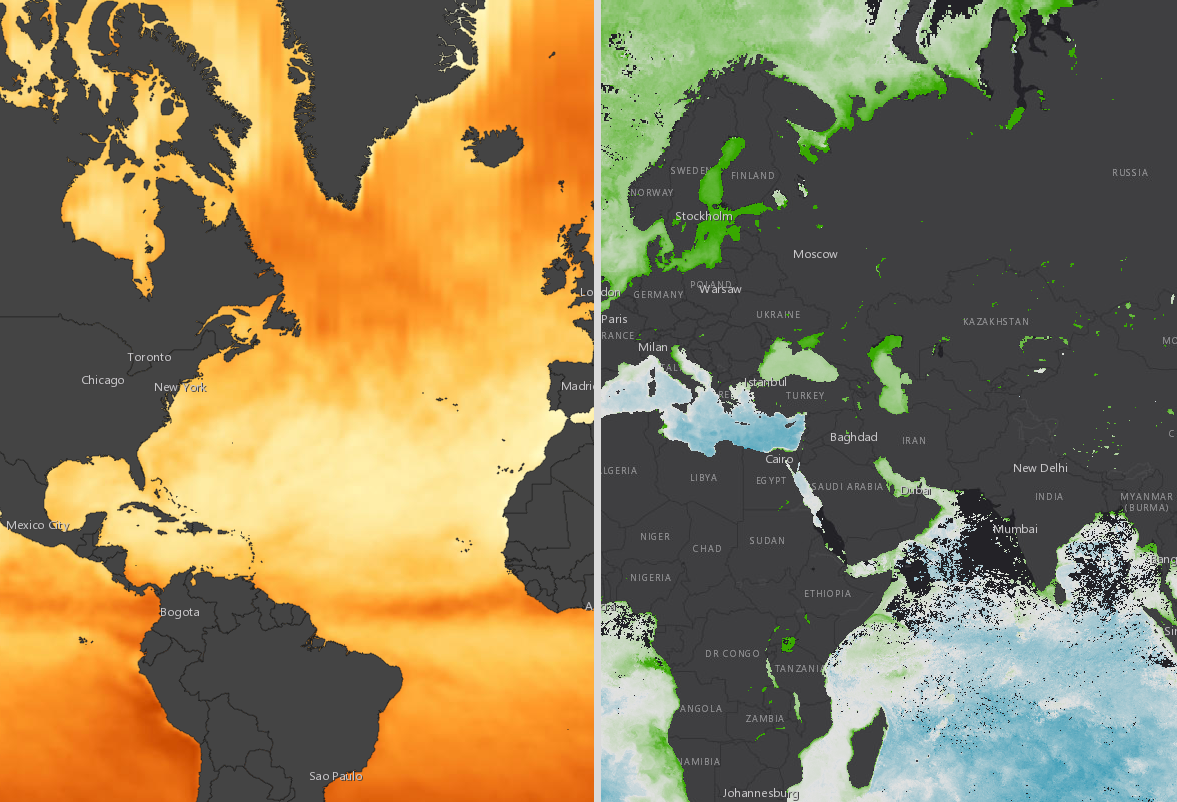
The maps show milligrams of chlorophyll per cubic meter of seawater for each month. Located above the map is a color scale bar. Places where chlorophyll concentrations are gray in color show very low numbers of phytoplankton. Places where chlorophyll concentrations are green in color show very high numbers of phytoplankton. These maps use data collected by the Moderate Resolution Imaging Spectroradiometer (MODIS) on NASA's Aqua satellite.
Observe the monthly seasonal chlorophyll concentration images in our global oceans for the four different months of 2017. Answer the following questions.
Steps:
-
Check with your instructor on how to submit your answers.
-
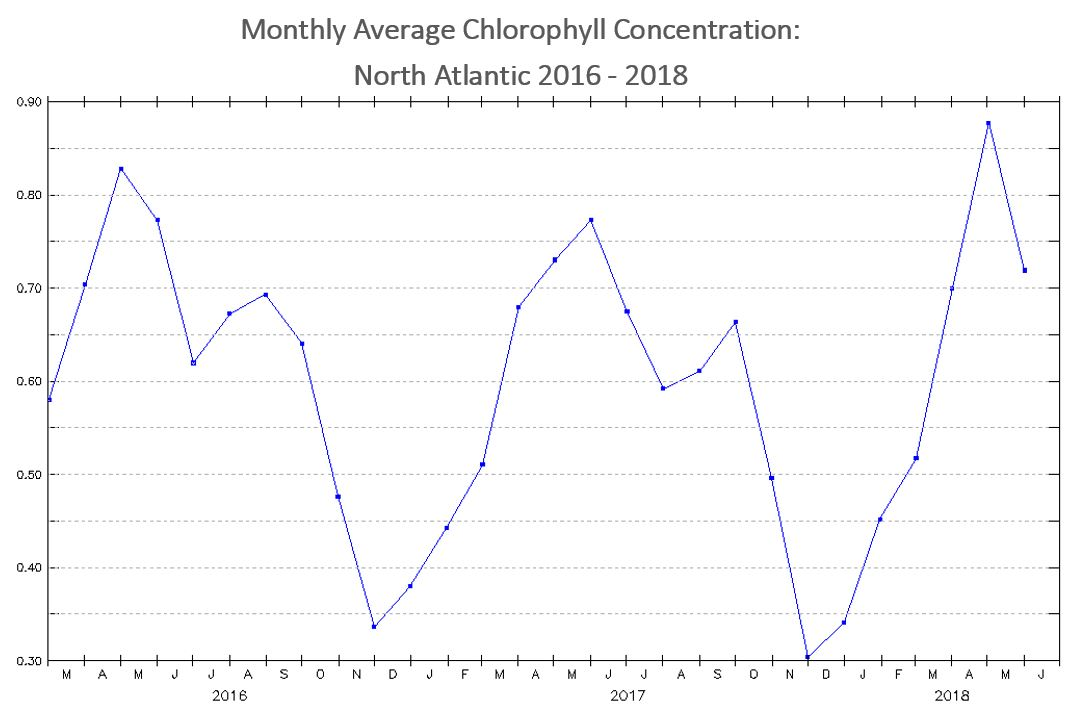
The chlorophyll maps (Plots A-D) are in chronological order, starting with the time periods: February 2017, June 2017, October 2017, and December 2017. Identify the seasonal cycles for chlorophyll concentrations throughout the year by answering the following questions:
- What changes do you see through the year? What explanations can you suggest for these patterns?
- Choose a location or region. During which months do the extreme highs and lows occur? What explanations can you suggest for the timing of those extremes?
- Which regions experience both the extreme highs and lows? Which regions don’t experience the extremes? Why do you think this happens?
- What differences, if any, do you find between the year’s variations over the coastal versus the year’s variations over the open oceans?
- Are there regions that remained relatively unchanged over the year? Why do you think this happens?
Source:
- LAS UI. (n.d.). My NASA Data. Retrieved June 27, 2022, from https://mynasadata.larc.nasa.gov/EarthSystemLAS/UI.vm#panelHeaderHidden…
Teacher Note
Teachers, these mini lessons/student activities are perfect "warm up" tasks that can be used as a hook, bell ringer, exit slip, etc. They take less than a class period to complete. Learn more on the "My NASA Data What are Mini Lessons?" page.
Teachers who are interested in receiving the answer key, please complete the Teacher Key Request and Verification Form. We verify that requestors are teachers prior to sending access to the answer keys as we’ve had many students try to pass as teachers to gain access.
Supported NGSS Performance Expectations
- MS-LS2-3: Develop a model to describe the cycling of matter and flow of energy among living and nonliving parts of an ecosystem.
- MS-ESS2-1: Develop a model to describe the cycling of Earth's materials and the flow of energy that drives this process.
- HS-LS2-5: Develop a model to illustrate the role of photosynthesis and cellular respiration in the cycling of carbon among the biosphere, atmosphere, hydrosphere, and geosphere.
Complementary Mini Lessons

Document Resources
Grade Band
- 6-8
- 9-12
Time
- 30 minutes