Interactive Models
Analysis & Application of Seasonal Vegetation Data
Overview
Students observe seasonal images of Monthly Normalized Difference Vegetation, looking for any changes in vegetation that are occurring throughout the year. They put the images in order based on what they know about seasonal changes.
Directions
Background:
As can be seen through a prism, many different wavelengths make up the spectrum of sunlight. When sunlight shines on objects, certain wavelengths are absorbed and other wavelengths are reflected. The pigment in plant leaves—chlorophyll—strongly absorbs visible light for use in photosynthesis. The cell structure of the leaves, on the other hand, strongly reflects near-infrared light. The more leaves a plant has, the more these wavelengths of light are affected. Scientists exploit this knowledge of plants' interactions with light to map the density of green vegetation across Earth's landscapes by designing satellite sensors to measure the wavelengths of red and near-infrared light that is absorbed and reflected by plants all over the world.
Subtracting plants' reflectance of red light from near-infrared light and then dividing that difference by the addition of the red and near-infrared light reflected produces a resulting value that scientists call Normalized Difference Vegetation Index (NDVI). The NDVI maps shown here were made using data collected by the Moderate Resolution Imaging Spectroradiometer (MODIS) aboard NASA's Terra satellite.
Plants are sensitive to their environment and so they serve as a good indicator whenever there is a change. Scientists routinely produce global NDVI maps to help them monitor and investigate shifts in plant growth patterns that occur in response to climate changes, environmental changes, and changes caused by humans. Farmers and resource managers also use NDVI maps to help them monitor the health of our forests and croplands. So these maps are used both for scientific research as well as societal benefit.
Student Directions:
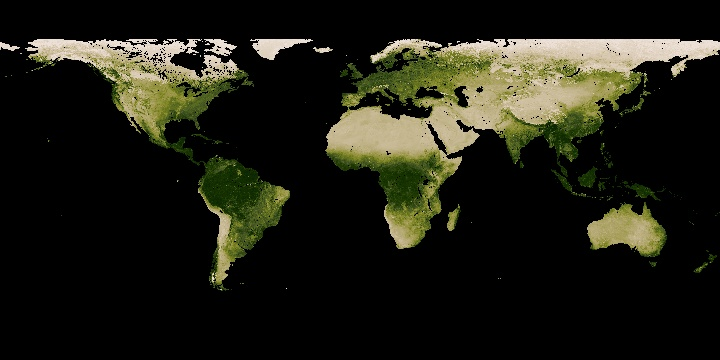
Observe the seasonal map of Monthly Normalized Difference Vegetation below, known as NDVI - a measure of the "greenness" of Earth's landscapes. Match the image with the four different maps for the months of 2017 offered in the Google Slide deck or in handouts provided by your teacher.
You will analyze these data for any changes in vegetation that are occurring throughout the year.
Source: My NASA Data, NASA MISR
https://mynasadata.larc.nasa.gov/sites/default/files/inline-images/NDVI_D_plot_image.png
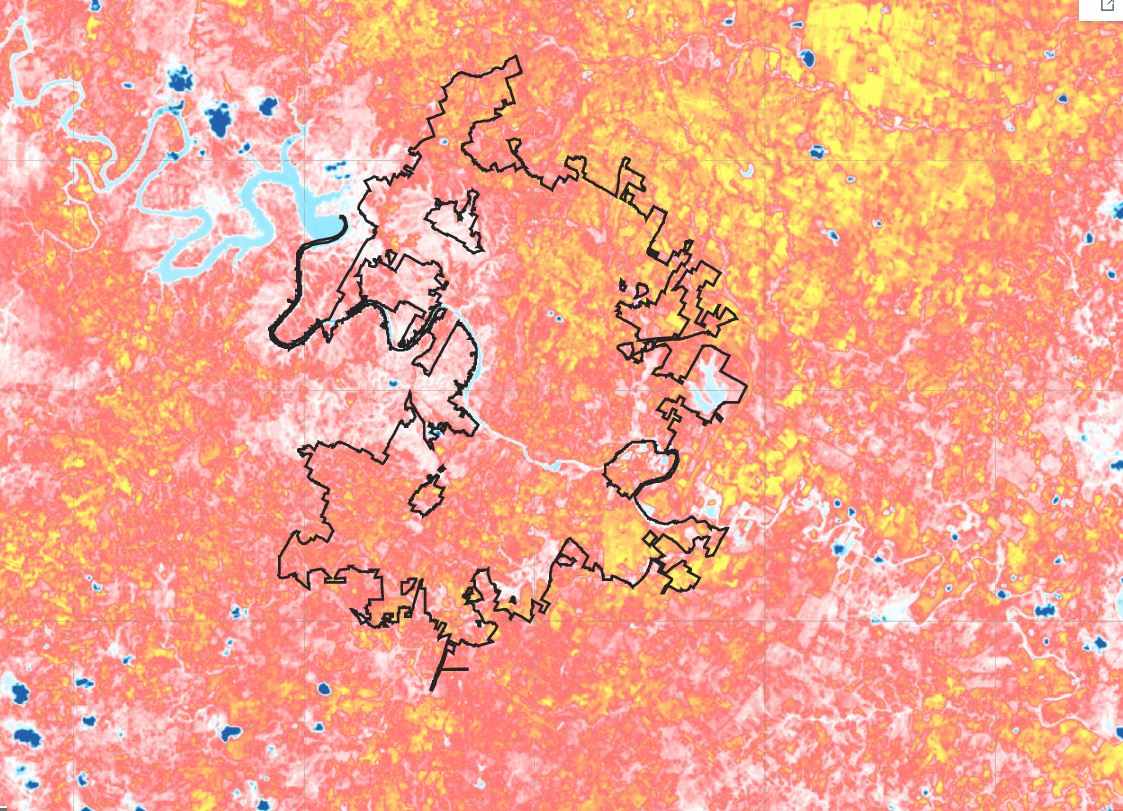
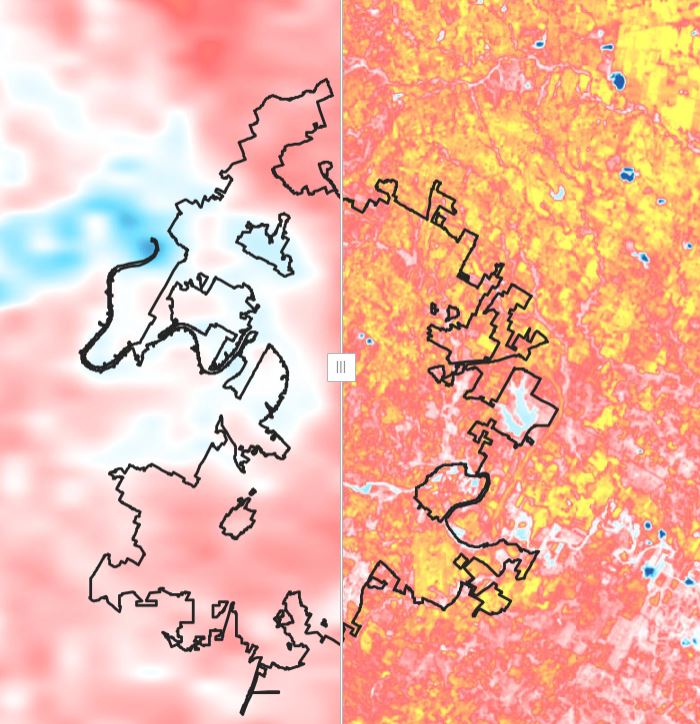
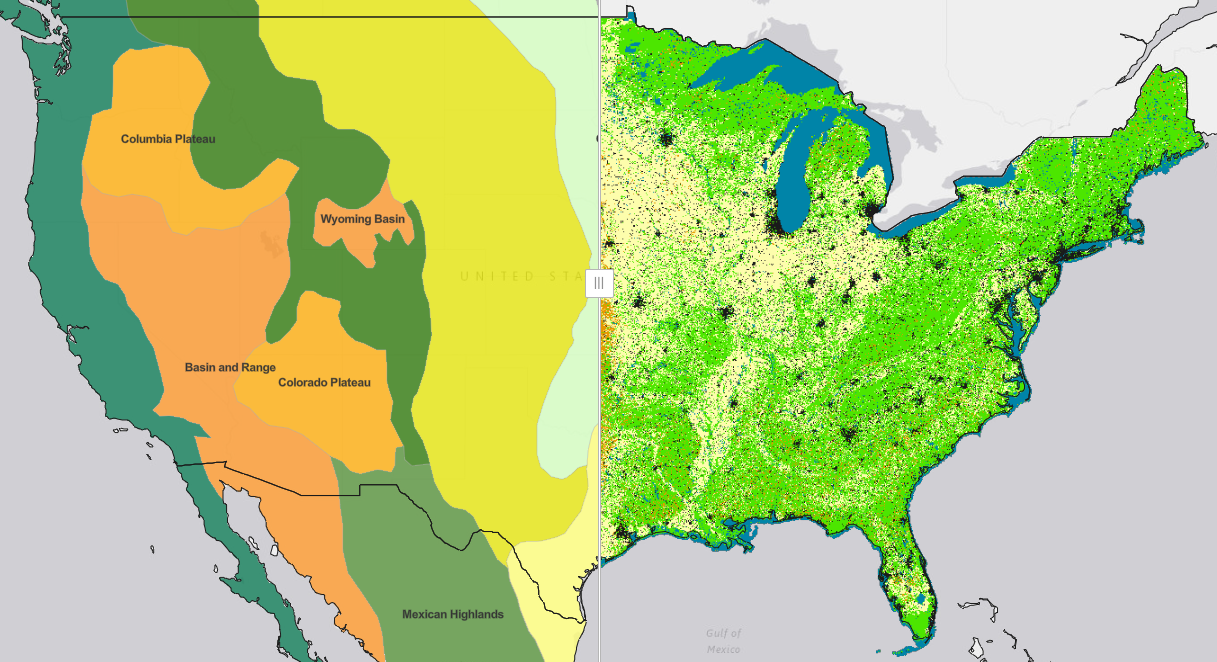
The colors on this maps show a measure of the "greenness" of Earth's landscapes. The values on these maps—ranging from -0.1 to 0.9—have no unit. Rather, they are index values in which higher values (0.4 to 0.9) show lands covered by green, leafy vegetation and lower values (0 to 0.4) show lands where there is little or no vegetation.
![]()
Steps:
- The vegetation maps (Images A-D) were created to represent the following time periods: February 2017, June 2017, October 2017, and December 2017 but are not in order. Match the maps with their corresponding months from 2017 based on your observations. For example, Map X = February 2017, etc.
- Identify the seasonal cycles for vegetation throughout the year by answering the following questions.
- What changes do you see through the year?
- Choose a location or region. During which months do the extreme highs and lows occur? What explanations can you suggest for the timing of those extremes?
- Which regions experience both the extreme highs and lows? Which regions don’t experience the extremes? Why do you think this happens?
Teacher Note
Teachers: The images can be downloaded, printed, and distributed in a Face-to-Face setting, along with the questions below. Alternatively, virtual learners will need to access the Google Slide to view the maps.
Teachers who are interested in receiving the answer key, please complete the Teacher Key Request and Verification Form. We verify that requestors are teachers prior to sending access to the answer keys as we’ve had many students try to pass as teachers to gain access.
- Standalone Lesson (no technology required)
- Internet Required
- One-to-One (tablet, laptop, or CPU)
- One-to-a-Group
- Teacher computer/projector only
Complementary Interactives

Document Resources
Interactive Files
Grade Band
- 6-8
Time
- 30 minutes