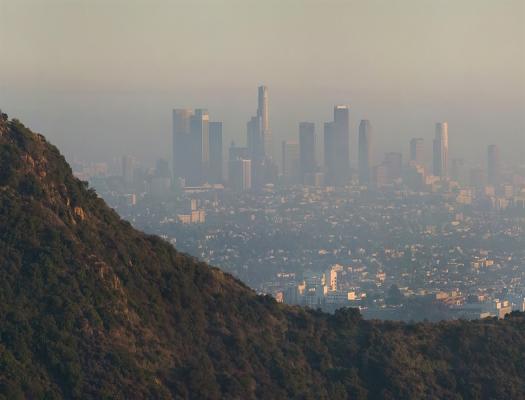
Air quality is a measure of the pollution level in the air. Monitoring air quality is important because polluted air can be bad for human health and the environment.
>> Read More >>
Just one moment,
loading Atmosphere...
Featured Lesson Plans
-
-
-
-
-
-
-
-
-
-
Grade Level: 6-8, 9-12
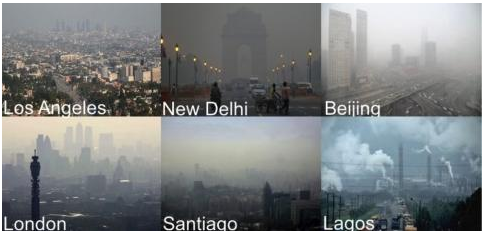
In this 5Es lesson, students will uncover how changes in global air quality have impacted human health in cities between 2000 and 2019.
Grade Level: 6-8
Students watch videos and/or review articles related to particulate matter and how this pollutant is monitored and measured, then provide their understanding individually or in groups.
Grade Level: 6-8
Students watch videos and review articles related to ozone as a pollutant at ground level, and how ozone impacts environment, then provide their understanding in groups.
Grade Level: 9-12
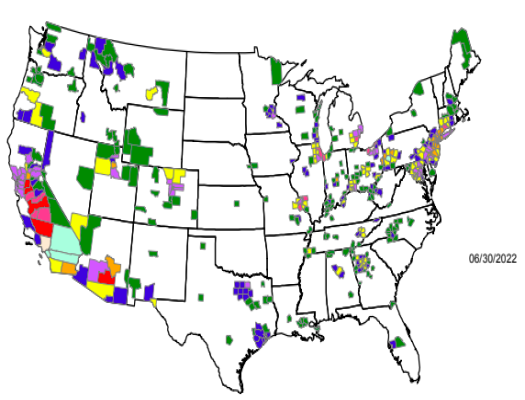
Students synthesize information from My NASA Data maps and texts from the EPA website to determine how levels of criteria pollutants have changed from 2005 to 2021. This research will prepare them to respond to the lesson’s essential questions during a Socratic seminar.
Grade Level: 9-12
Students will engage in a “Zoom In Inquiry” learning routine to understand a world map that shows changes in PM2.5-attributable mortality per 100,000 population (Bondie, 2013).
Grade Level: 6-8, 9-12
Students will explore the relationship between Nitrogen Dioxide and Precipitation in Earth's atmosphere. They will explore the data provided, make a claim, and complete a slide guided by a rubric.
Grade Level: 6-8
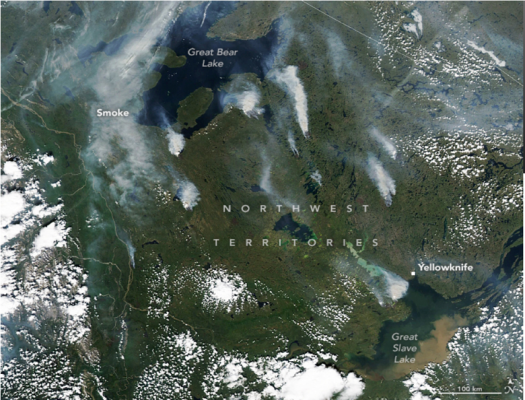
Students will analyze images and data from a variety of NASA sensors and satellites depicting the wildfires of northern Canada to understand the state of the atmosphere at the time. Then they will answer a series of questions.
Grade Level: 9-12
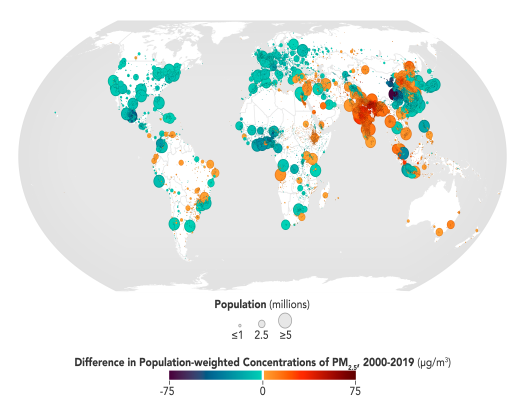
Students will engage in a “Zoom In Inquiry” learning routine to understand the symbols on a world map that shows population-weighted concentrations of PM2.5. They will reflect on how their perception of the image changed as they saw more of the image.
Grade Level: 6-8
This lesson uses the National Park Service StoryMap which displays national parks around the contiguous United States and their standard exceedance ozone concentrations from 2016-2021. Students will explore ozone levels and answer questions.
Grade Level: 9-12
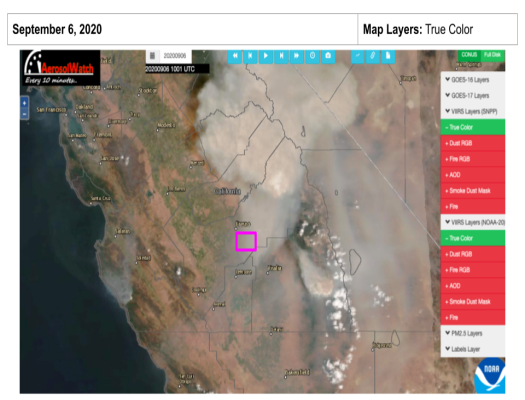
In this 5E’s lesson, students observe maps that show smoke and AOD levels surrounding Fresno, California at the time when the 2020 Creek Fire was burning. Students construct a claim that identifies a relationship between fire-related data and air quality data.
Previous
Next
Grade Level: 3-5,
6-8,
9-12
The activities in this guide will help students understand variations in environmental parameters by examining connections among different phenomena measured on local, regional and global scales.
Grade Level: 6-8
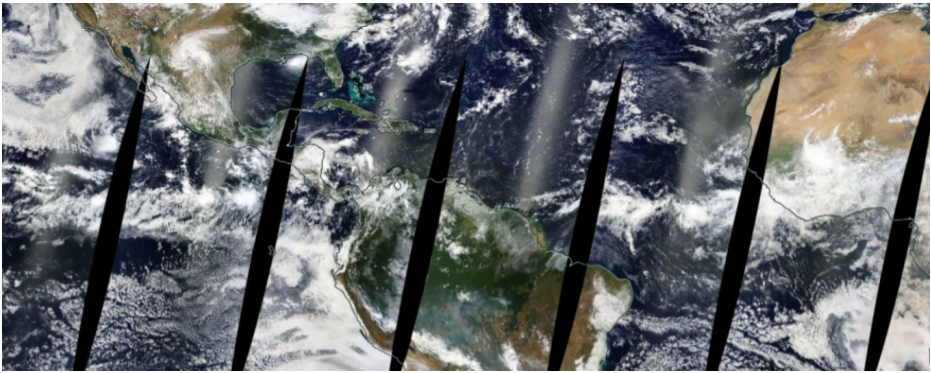
Worldview is a valuable resource in understanding information about the atmosphere. Learn how to access models in order to answer your own questions.
Grade Level: 9-12
Students will engage in a “Zoom In Inquiry” learning routine to understand a world map that shows changes in PM2.5-attributable mortality per 100,000 population (Bondie, 2013).
Grade Level: 9-12
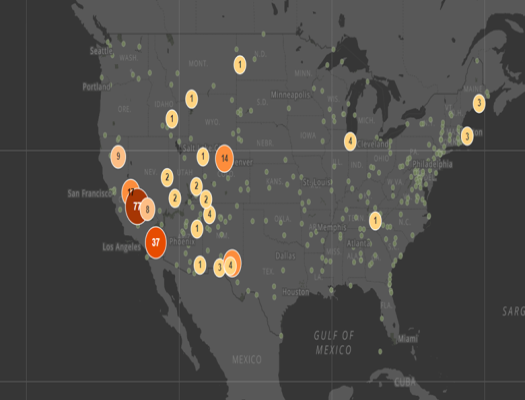
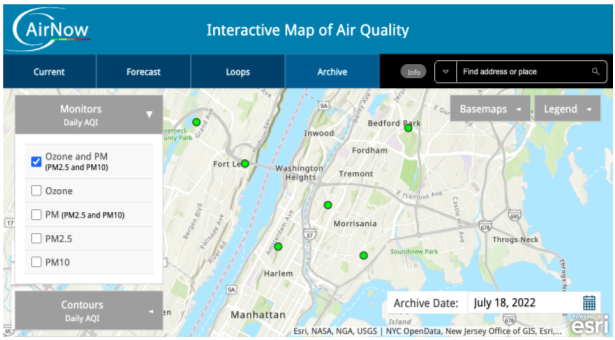
Students interpret AQI maps and charts to compare today’s AQI with the past five days. Using the EPA’s air quality activity guides, students create a social media post for residents of their region providing key information related to today’s AQI.
Grade Level: 6-8
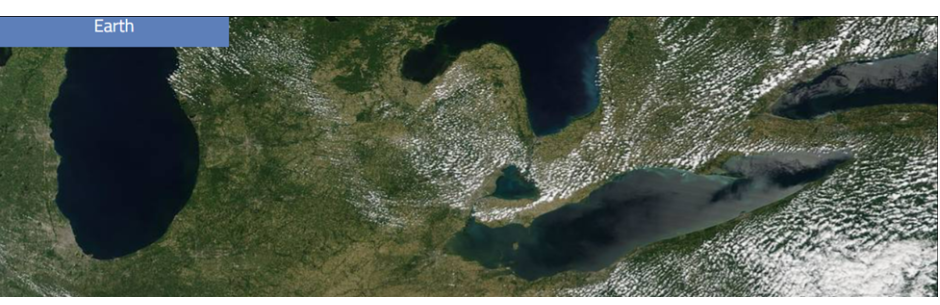
NASA makes observations and collects data about ozone in the Great Lakes region. Read about the research and analyze related data.
Grade Level: 6-8,
9-12
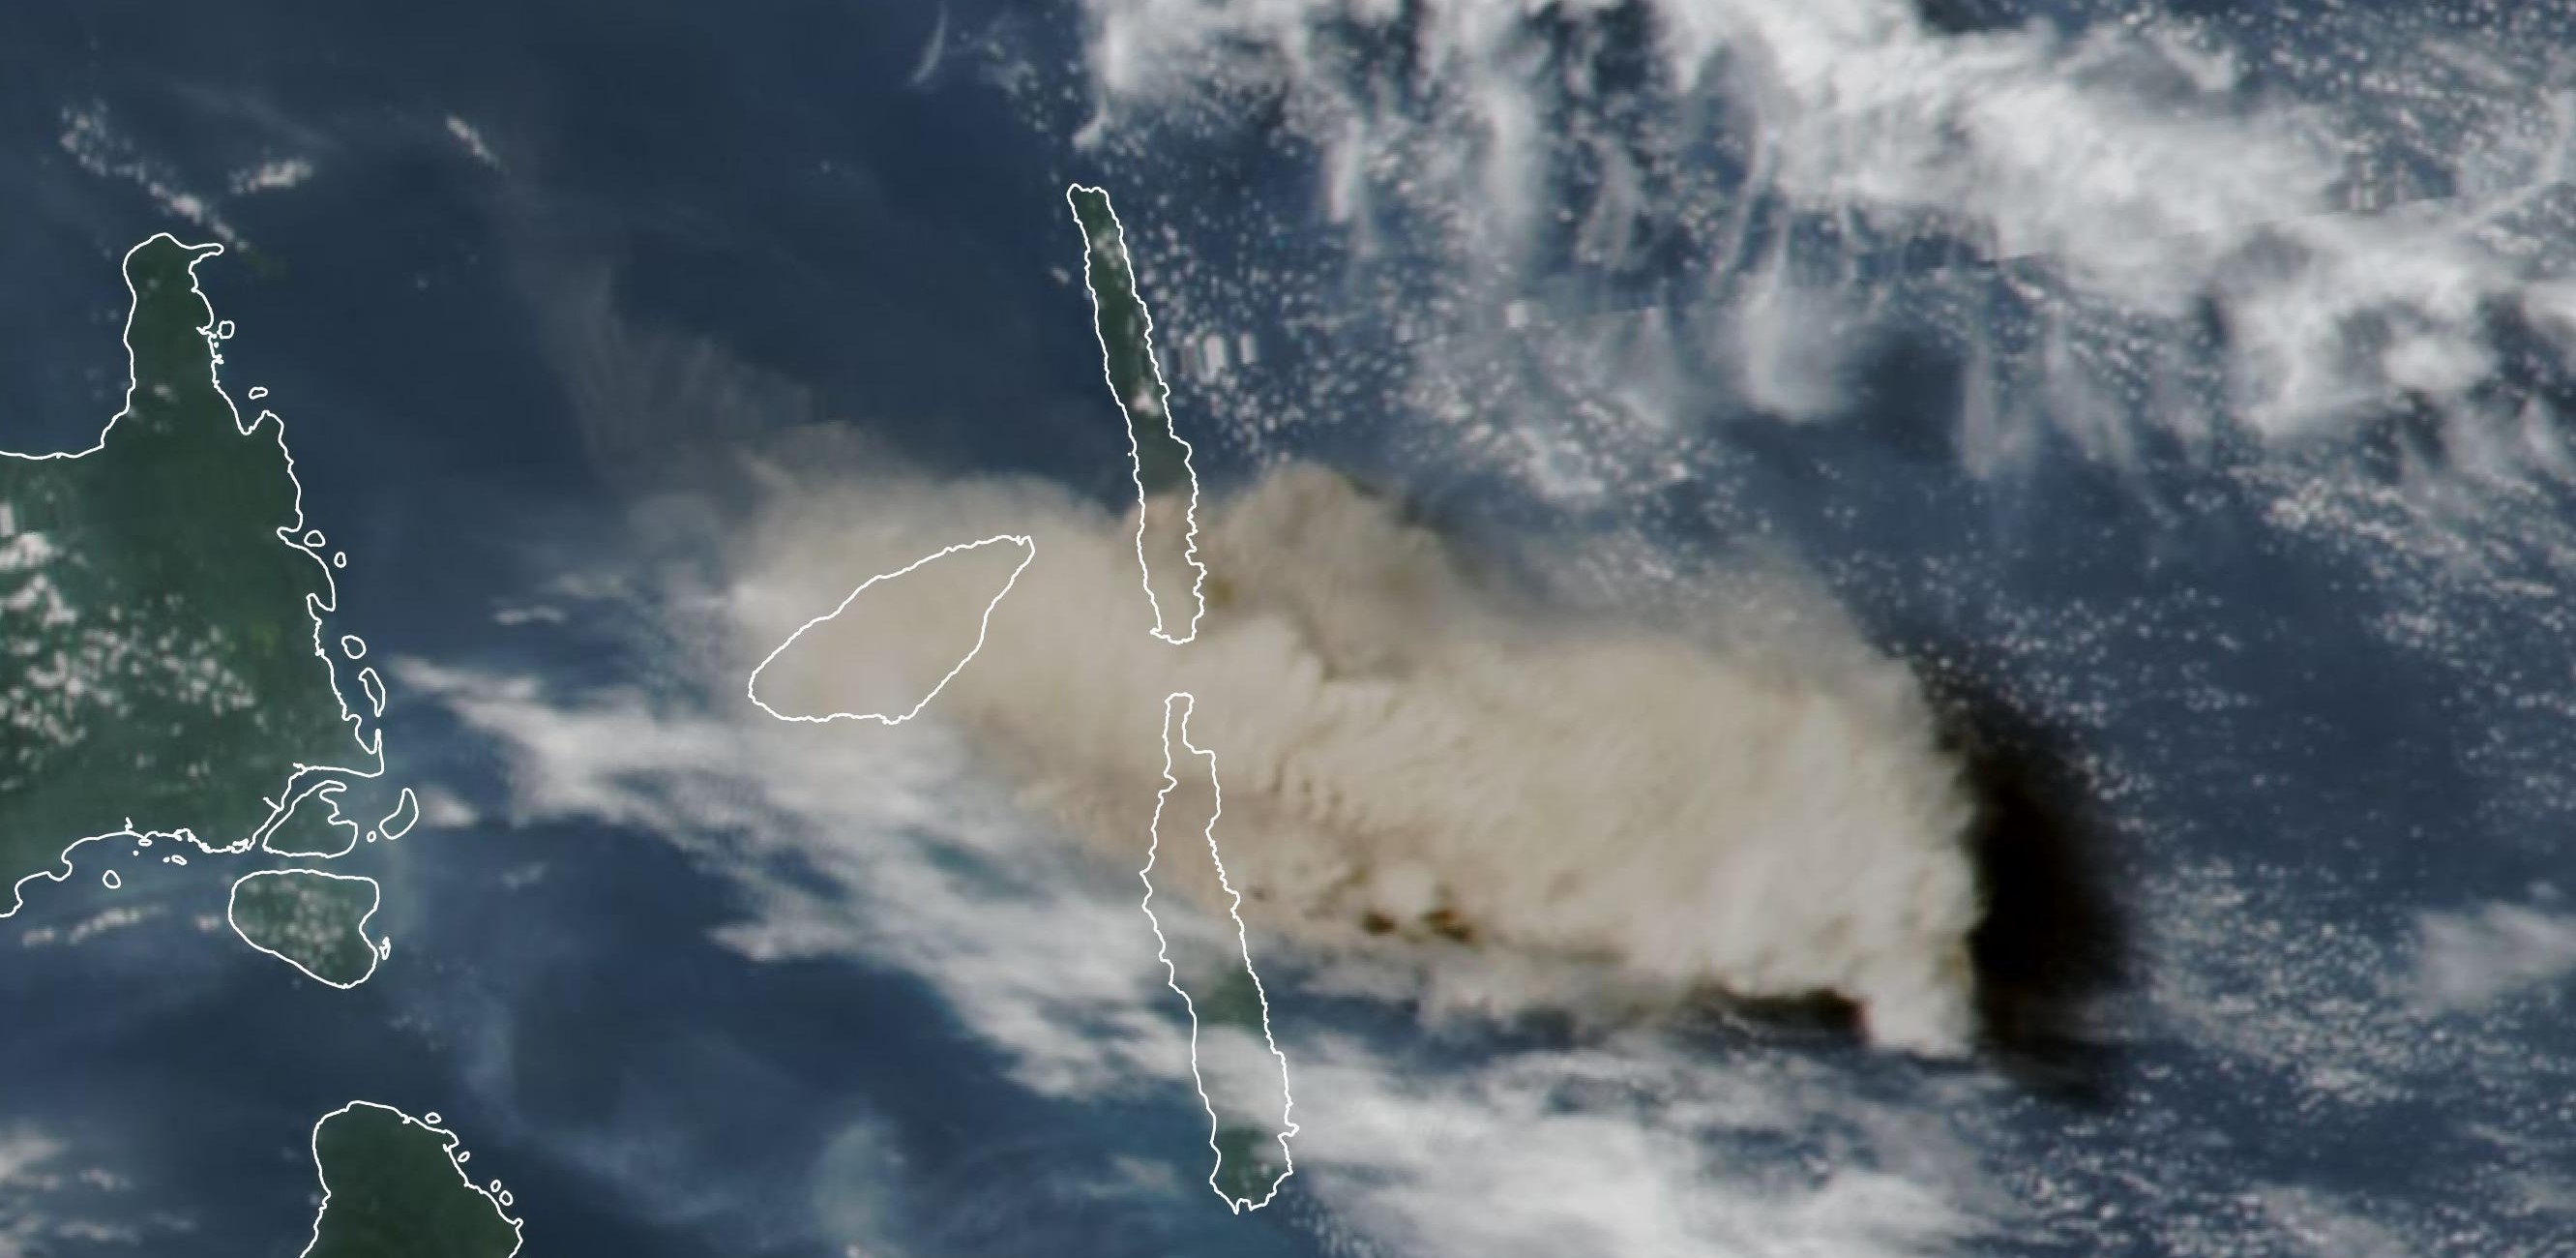
Use the Earth System Data Explorer to analyze data and make a claim about which 2018 eruption was larger, Kilauea, HI or Ambae Island, Vanuatu.
Grade Level: 6-8,
9-12
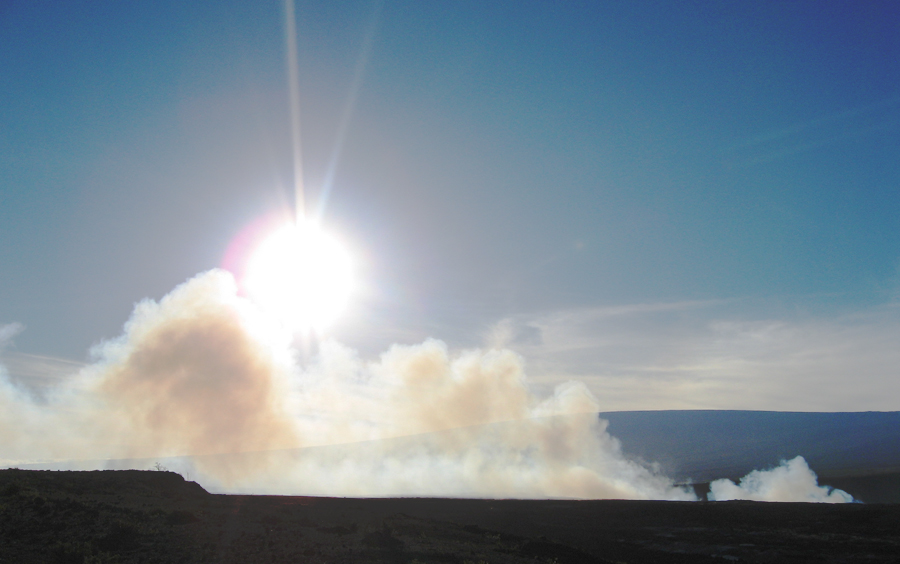
Students will use NASA Satellite data of aerosol optical depth and sulfur dioxide as a tool to find evidence of volcanic activity at Kilauea, HI.
Grade Level: 3-5,
6-8,
9-12
NASA visualizers take data – numbers, codes – and turn them into animations people can see and quickly understand.
Grade Level: 3-5,
6-8
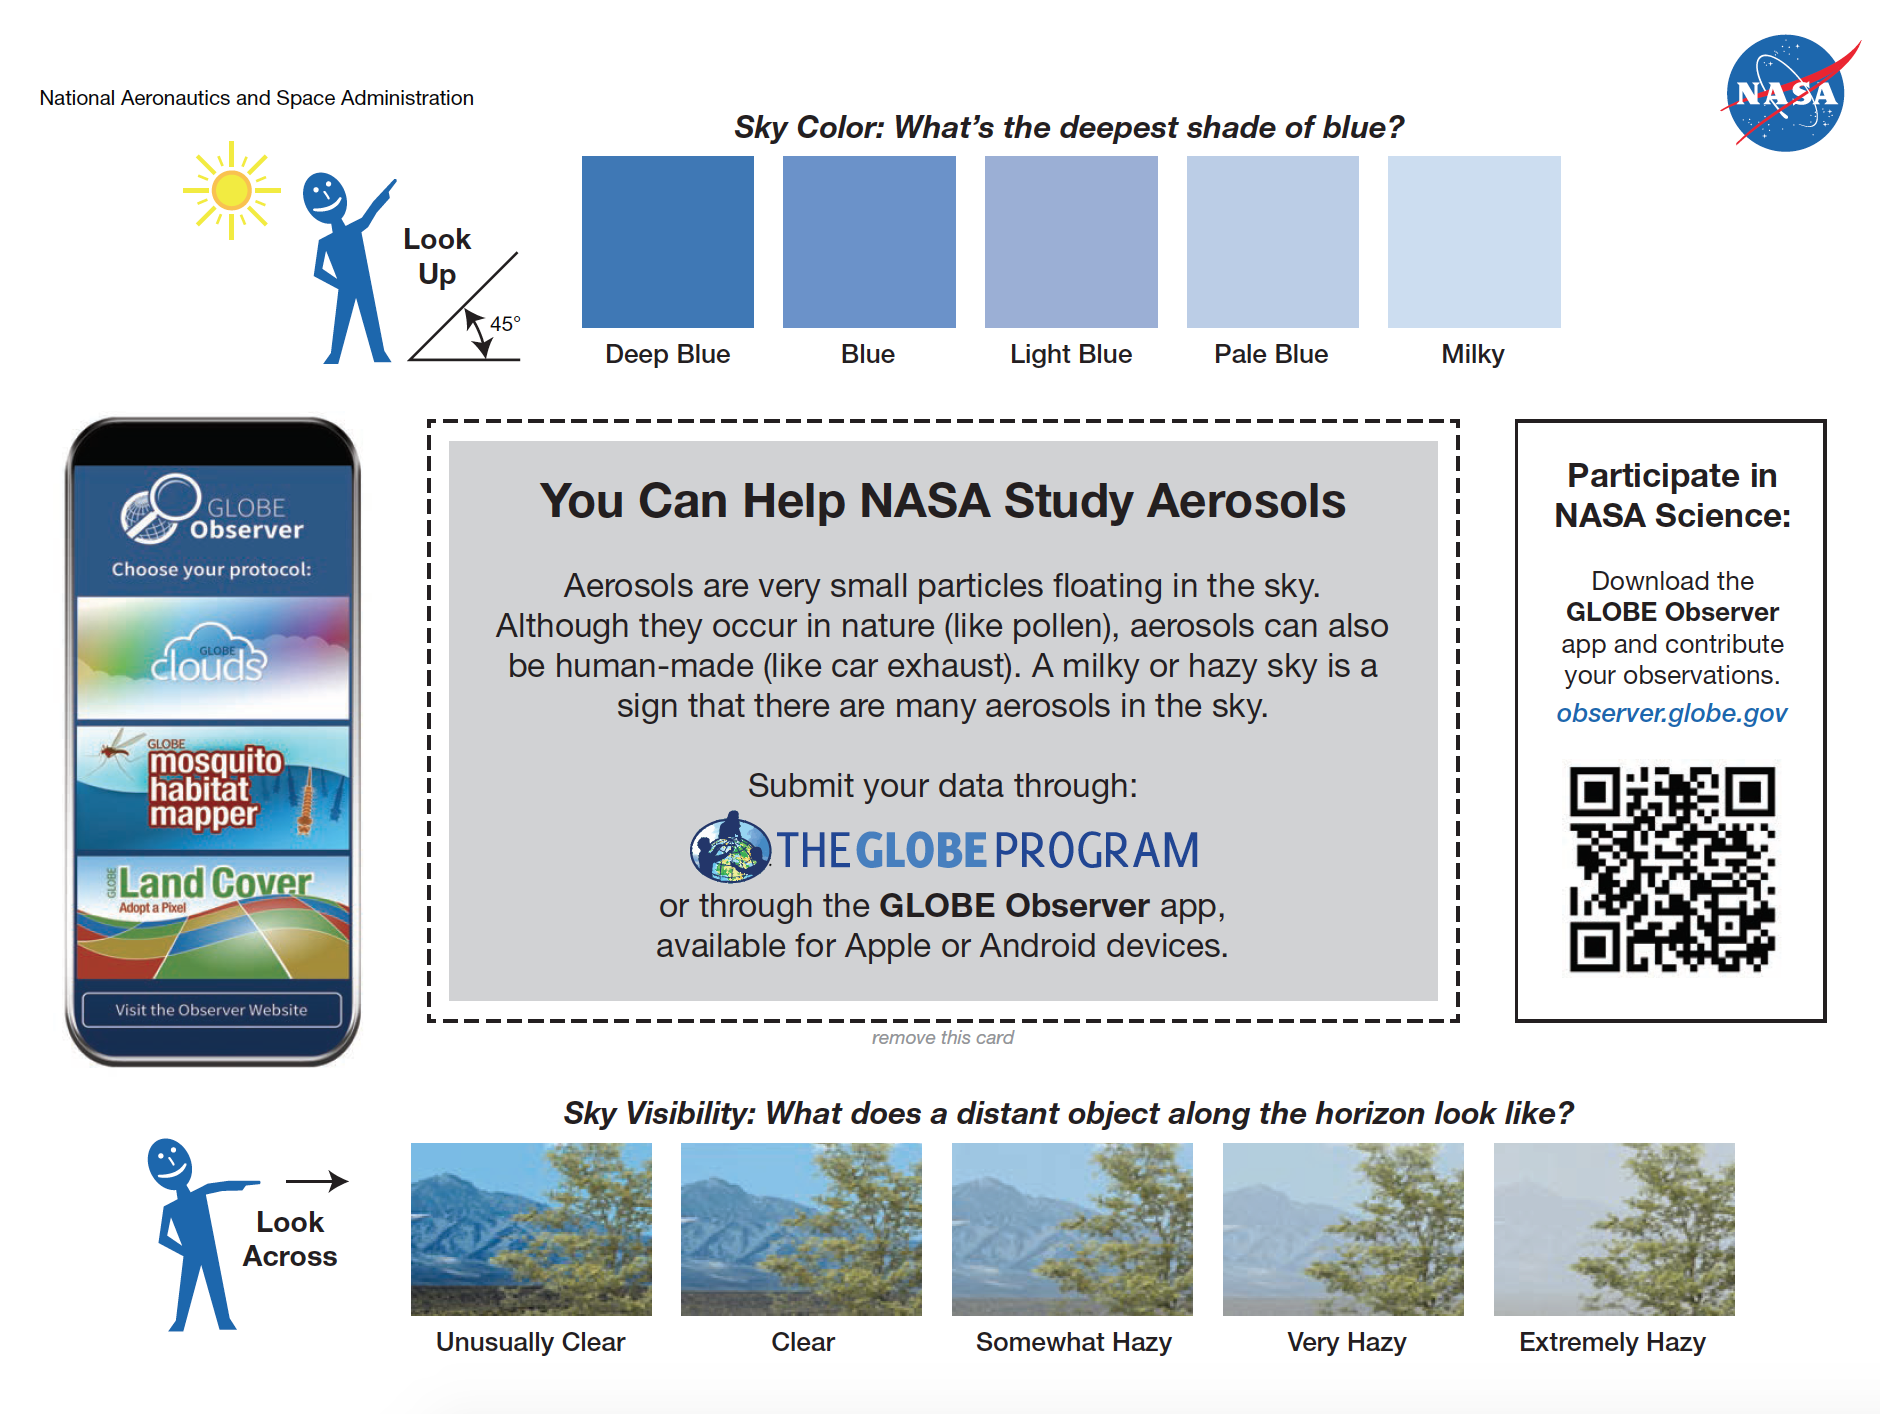
In this activity, we will introduce children to the colors of the sky. Children love to look at clouds. Here we will focus in on the sky in which clouds float. Children will learn why the sky has such a wide range of colors.
Air quality landing page. Explore maps, graphs, data, and related education resources. These resources include lesson plans, mini lessons, activities, and datasets for teachers and students.