Lesson Plans
Nitrogen Dioxide and Precipitation
Overview
Students will explore the relationship between Nitrogen Dioxide and Precipitation in Earth's atmosphere. They will explore the data provided, make a claim, and complete a slide guided by a rubric.
Materials Required
Procedure
- Review the Teacher Background Information Slides with the students.
- Develop a question or questions for inquiry.
- The data available are monthly NO2 and monthly precipitation data for one location. Keep this in mind when framing questions to make sure the data address the questions.
- Teachers can develop a question for the entire class to use, develop a question with the class or have groups develop their own questions.
- Have students record their questions in their notes or on their slides.
- Sample questions include:
- How does precipitation affect nitrogen dioxide concentrations?
- When there is more precipitation in a month, what happens to NO2 levels?
- Have students connect the background information to the question they are investigating by writing two or three sentences in their notes or on their slides.
- Select one of the data files to share with students.
- The data files are spreadsheets. They can be used by most spreadsheet software or saved as a CSV file and imported to other data analysis tools of your choice.
- Direct students to analyze the data. Students must create a visualization of some sort using the software of your choice or by hand. Answer keys use a double line graph.
- Students should use their visualizations to find evidence related to their question and record the evidence.
- Students will use their evidence to make a claim.
- Provide the Student Slide Template and Rubric for students to complete. They will complete the following sections:
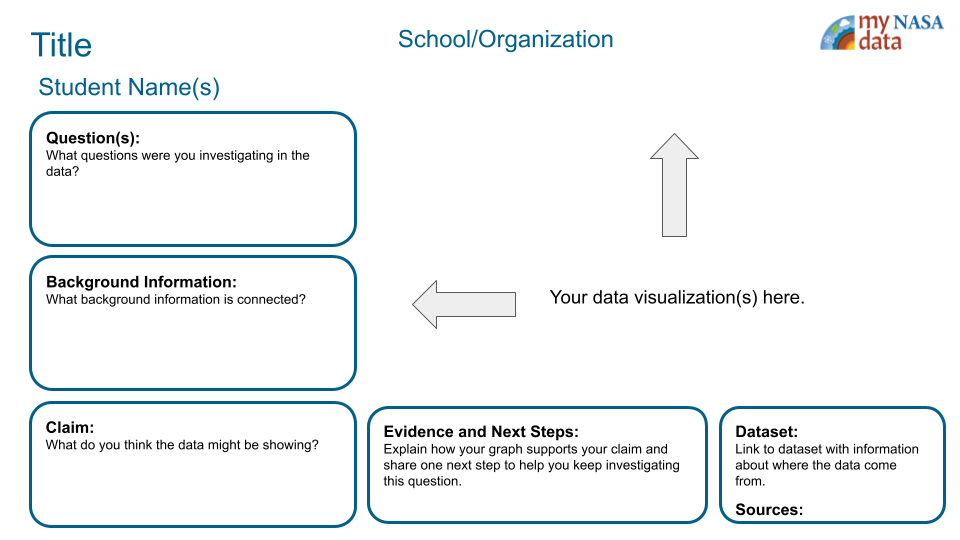
- Question
- Background Information
- Visualization
- Claim
- Evidence and Next Steps
- Dataset link and Sources
- Students can work in small groups or individually.
- Optional:
- Students can watch some or more of the following videos when working with the data.
- Have students share their slides with the class.
Answers:
Teachers who are interested in receiving the answer key, please complete the Teacher Key Request and Verification Form. We verify that requestors are teachers prior to sending access to the answer keys as we’ve had many students try to pass as teachers to gain access.
Sources:
- “Basic Information about NO2 | US EPA.” Environmental Protection Agency (EPA), 25 July 2023, https://www.epa.gov/no2-pollution/basic-information-about-no2. Accessed 30 January 2024.
- “Glossary | Precipitation Education.” NASA GPM, https://gpm.nasa.gov/education/glossary. Accessed 30 January 2024.
Disciplinary Core Ideas:
- ESS2A: Earth Materials and Systems
Crosscutting Concepts:
- Patterns
- Cause and Effect
Science and Engineering Practices:
- Analyzing and Interpreting Data
- Students will identify patterns in data.
- Students will make a claim about data.
- How are Nitrogen Dioxide and precipitation related in Earth's atmosphere?
Students should be familiar with using data to create a time series graph in the chosen software.
- Have students analyze both data files.
- After the students create the graphs, use the Data Literacy Cubes graph questions.
- Internet Required
- One-to-One (tablet, laptop, or CPU)
- One-to-a-Group


Interactive Files
Grade Band
- 6-8
- 9-12
Time
- > 90 minutes
Visualization Tool
NGSS Three Dimensional Learning
- See drop-down menu at the bottom of the page