Mini Lesson/Activity
Ocean Salinity Data Analysis
Overview
In this mini lesson, students use in-water profiles of historical ocean data to analyze how sea surface salinity varies with depth.
Student Directions
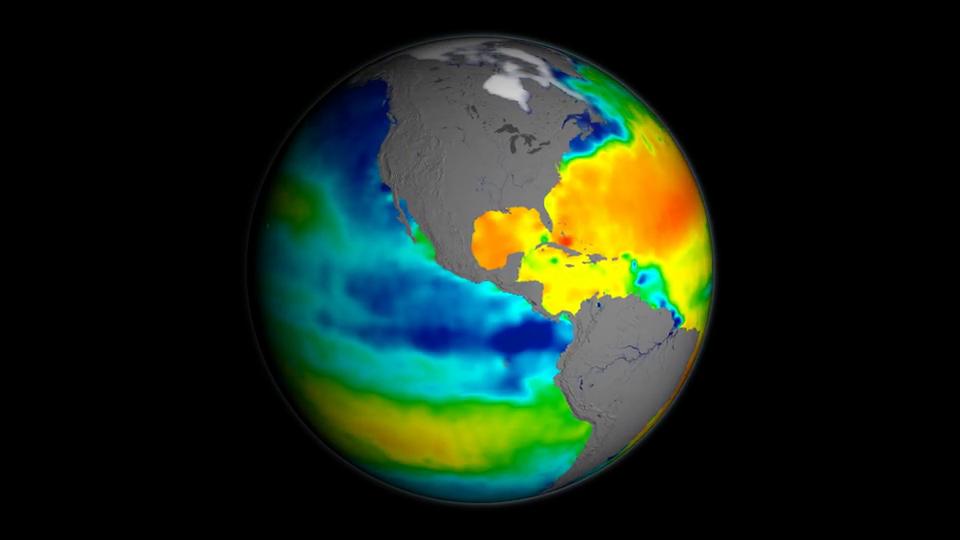
Sea surface salinity describes the amount of salt in the water at the ocean surface. In deep ocean waters, there are currents that are controlled by water density, which depends on the temperature and salinity of the water. Colder, saline water masses are more dense and sink; while warmer, fresher water masses are less dense and rise.
UNITS: Salinity is measured in practical salinity units (psu). These units are equivalent to grams per kilogram, which in this case is 1 gram of dissolved salt per 1 kg of water.
Steps:
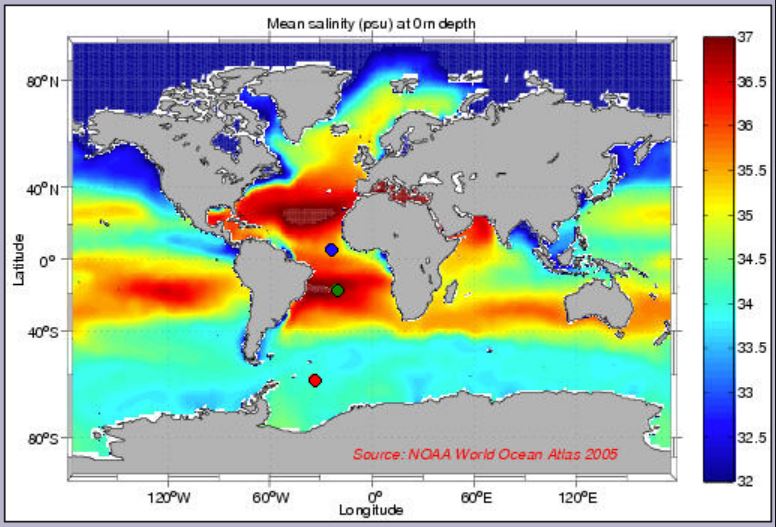
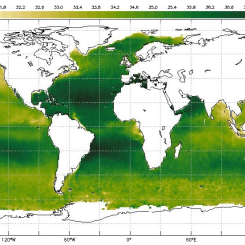
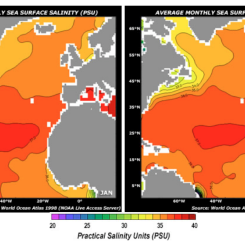
1. Explore the map of surface salinity that was used to create in-water profiles of how the salinity changes with depth.
- How do we know that map shows only surface conditions?
Credit: NASA Aquarius
https://mynasadata.larc.nasa.gov/sites/default/files/inline-images/Salinity.JPG
2. Answer the following questions. Check with your instructor on how to submit your answers.
- Observe the color bar. What colors represent the high salinity values?
- Locate the blue, green, and red dots in the image above showing key locations for maps and in-water salinity profiles. What colors are represented by the coordinates below?
- 5N, 24W
- 18S, 20W
- 62S, 34W
Credit: NASA Aquarius
https://mynasadata.larc.nasa.gov/sites/default/files/inline-images/aquarius_1567696634325_S.gif
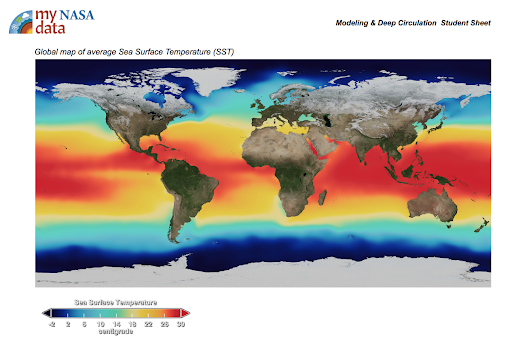
3. Review the features of the in-water profile graph. The graph displays mean salinity plotted against ocean depth for each of the three sites shown in the map of surface salinity.
- How does salinity vary with depth? Describe by using evidence for the three sites.
- How does salinity affect ocean currents?
Teacher Note
Teachers, these mini lessons/student activities are perfect "warm up" tasks that can be used as a hook, bell ringer, exit slip, etc. They take less than a class period to complete. Learn more on the "My NASA Data What are Mini Lessons?" page.
Teachers who are interested in receiving the answer key, please complete the Teacher Key Request and Verification Form. We verify that requestors are teachers prior to sending access to the answer keys as we’ve had many students try to pass as teachers to gain access.
Disciplinary Core Ideas:
- ESS2A: Earth Materials and Systems
Crosscutting Concepts:
- Scale, Proportion, and Quantity
- Systems and System Models
- Structure and Function
Science and Engineering Practices:
- Analyzing and Interpreting Data
Complementary Mini Lessons


Grade Band
- 6-8
Time
- 30 minutes
Visualization Tool
NGSS Three Dimensional Learning
- See drop-down menu at the bottom of the page