White biosphere icon
Just one moment,
loading Biosphere...

Featured Lesson Plans

Grade Level: 6-8, 9-12

Students analyze historic plant growth data (i.e., Peak Bloom dates) of Washington, D.C.’s famous cherry blossom trees, as well as atmospheric near surface temperatures as evidence for explaining the phenomena of earlier Peak Blooms in our nation’s capital.

Grade Level: 3-5, 6-8

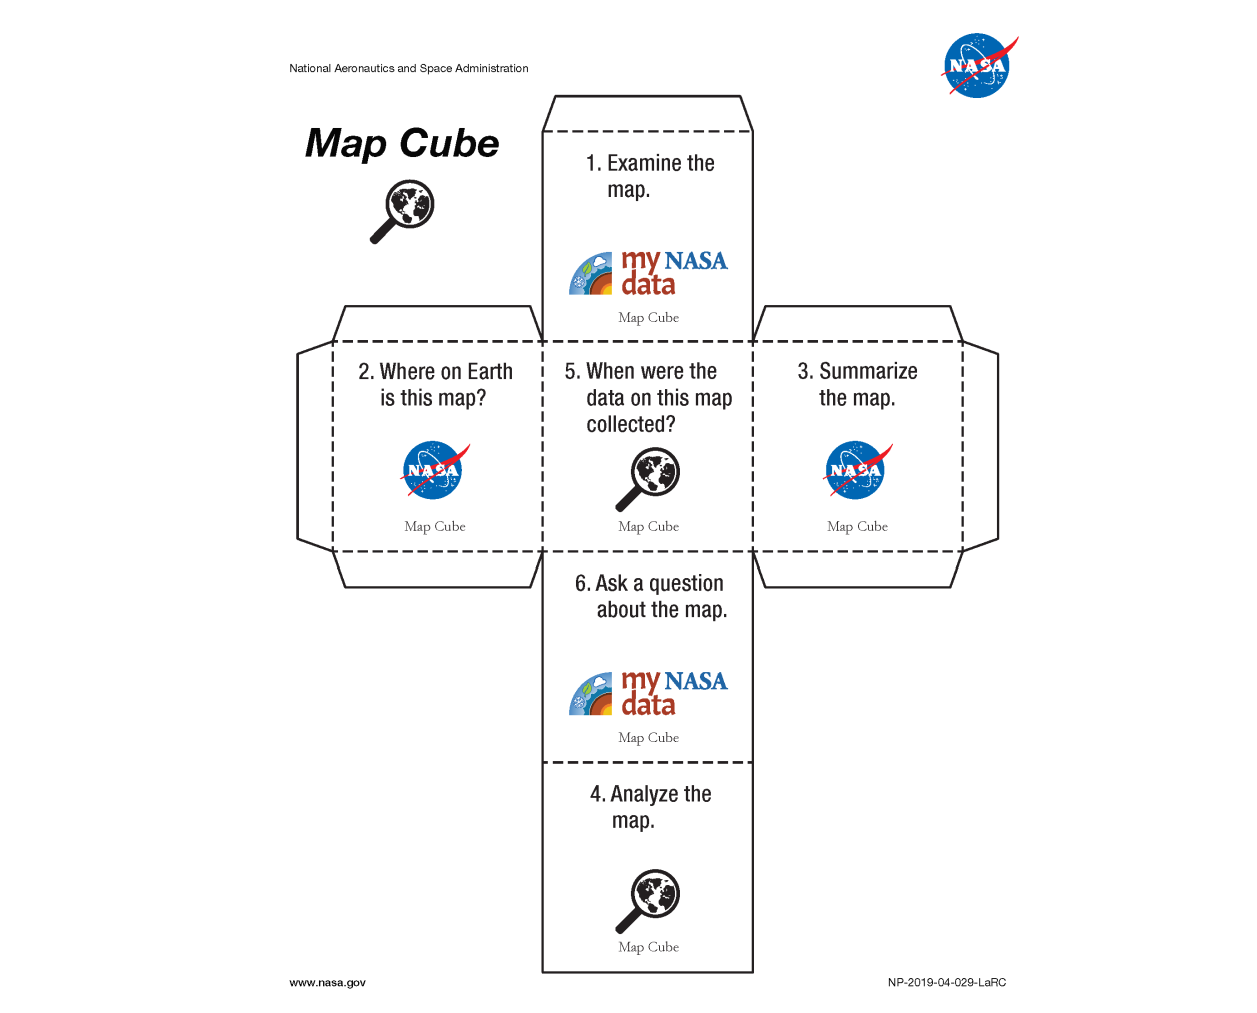
Use the Data Literacy Cubes to guide students’ exploration of mapped data of the Earth System to enrich their observations and inferences.  This is a flexible resource that may be used with a variety of mapped images.  This activity requires a map of Earth data for students to evaluate.

Grade Level: 3-5, 6-8, 9-12

The activities in this guide will help students understand variations in environmental parameters by examining connections among different phenomena measured on local, regional and global scales.

Grade Level: 6-8, 9-12

This lesson walks students through the use of Landsat false-color imagery and identification of different land cover features using these as models. Building from an original GLOBE lesson, this resource features Google Slide and Jamboard to assist in both face-to-face and virtual learning.

Grade Level: 3-5, 6-8, 9-12

Learners follow adventurous camper, Awenasa, as she travels the United States and attends various camp locations throughout the year.  Learners analyze data to find her location among the various campsites using monthly averaged NASA satellite data (Cloud Coverage, S

Grade Level: 3-5, 6-8, 9-12

This lesson, "Awenasa Goes to Camp!," is a data analysis activity that presents maps of NASA Earth satellite data for a variety of locations