Lesson Plans
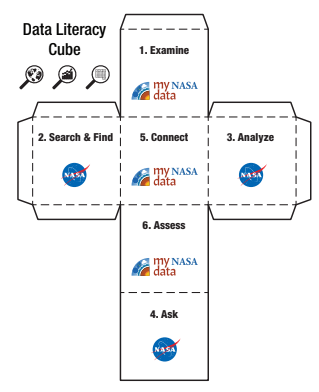
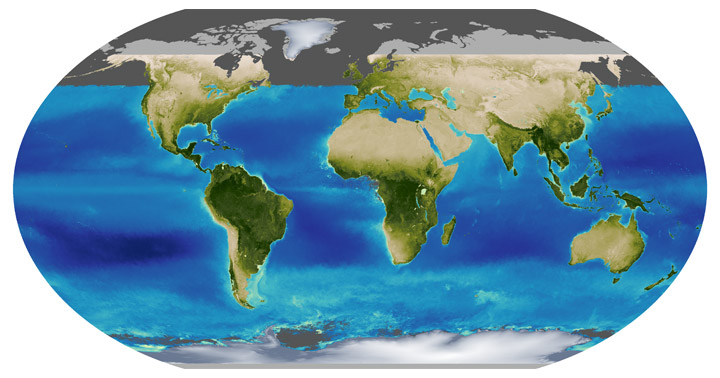
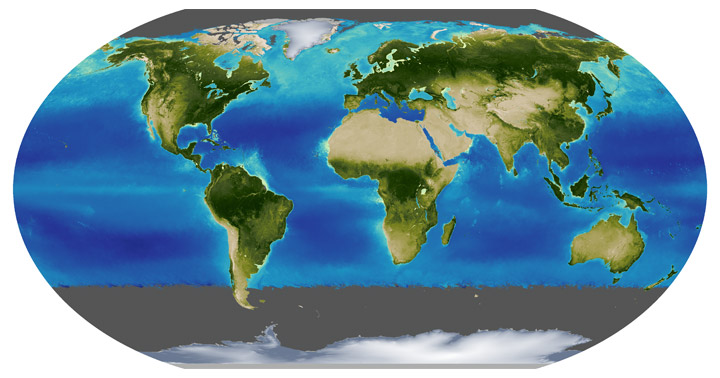
Data Literacy Cube: Using Seasonal Vegetation Mapped Images
Overview
Use the Data Literacy Cube to guide students’ exploration of mapped data of the Earth System to enrich their observations and inferences. This is a flexible resource that may be used with a variety of mapped images. This activity requires a map of Earth data for students to evaluate.
Materials Required
- 1 Cube per group/student
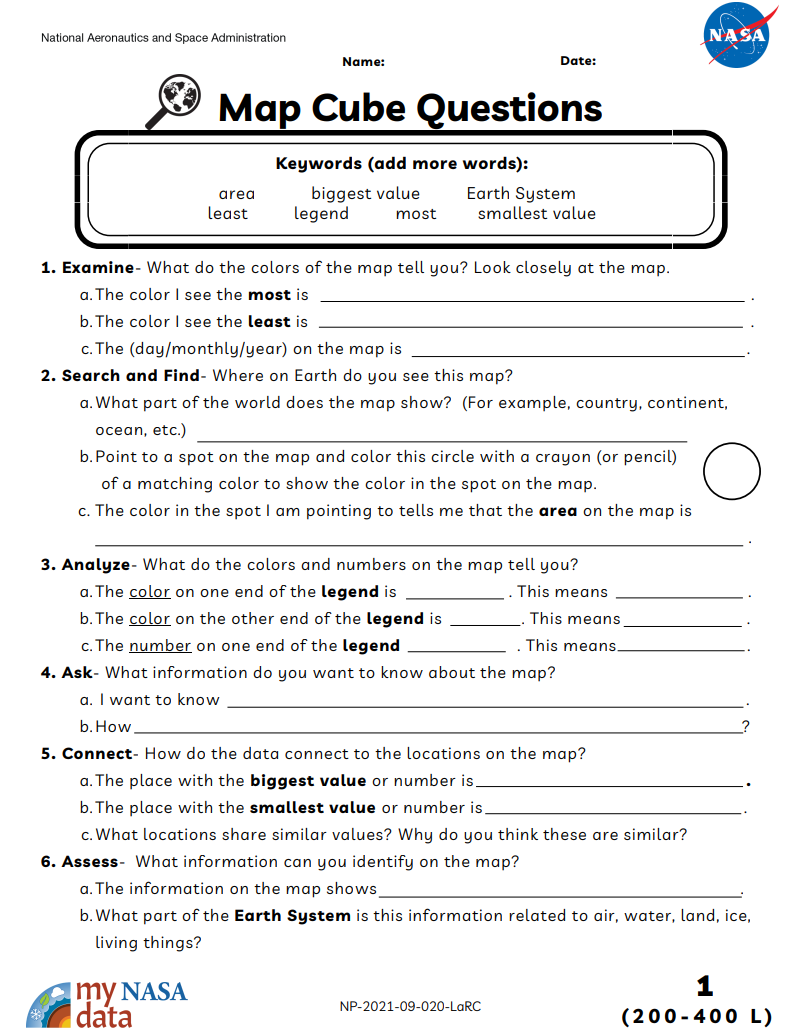
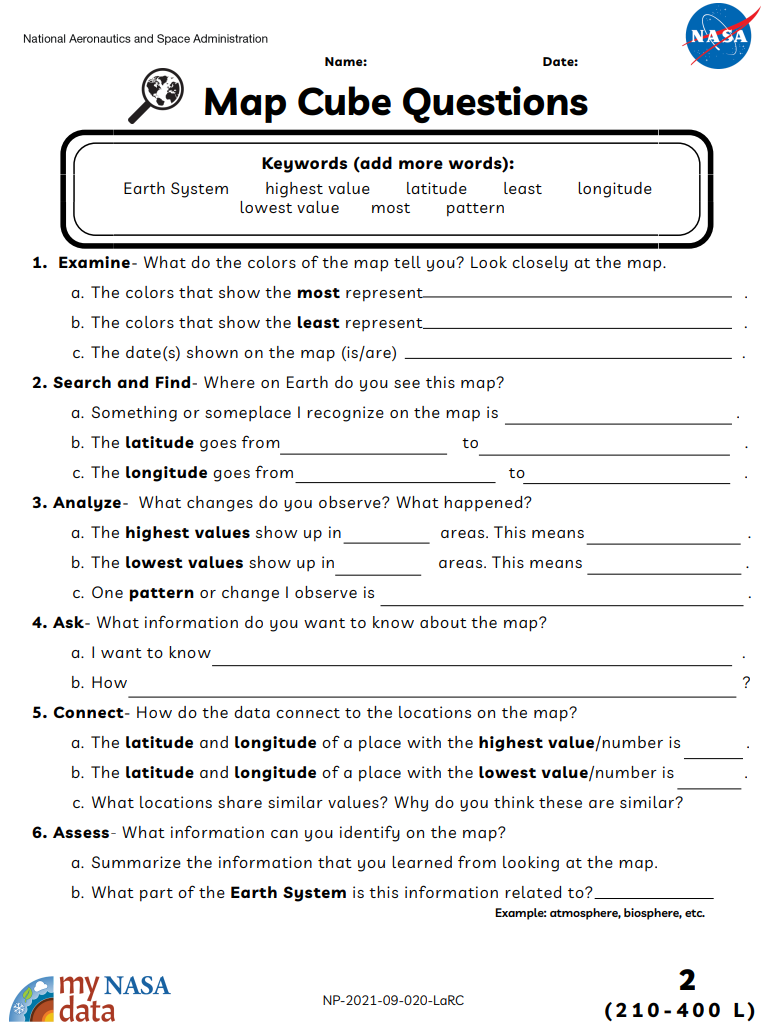
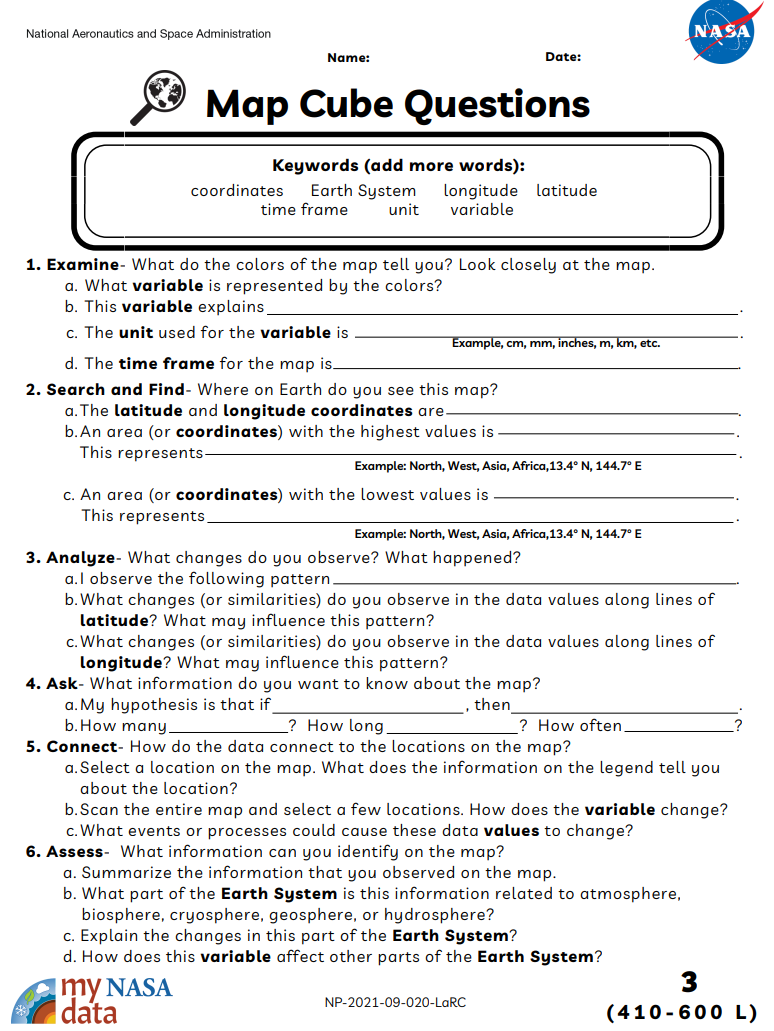
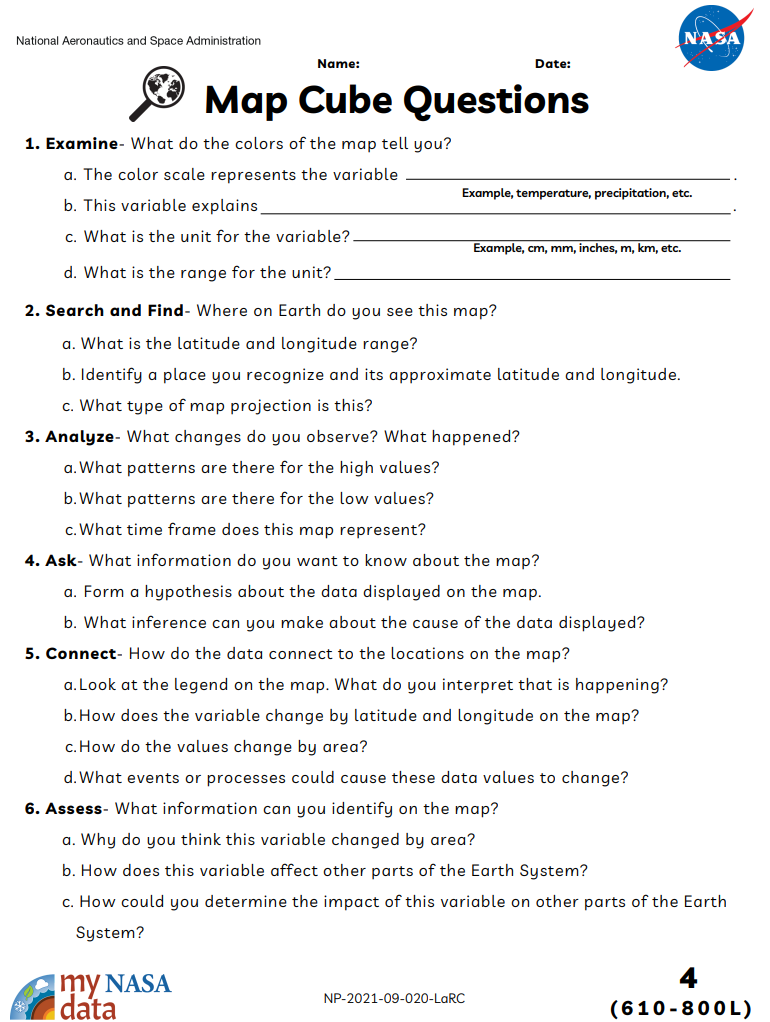
- 1 differentiated Map Cube Question Sheet per student
- 1 sheet of paper per student
- Pencil
- *Dataset:
- *MND offers a variety of Earth System maps to integrate with the Data Literacy Cube tool. Look for the
 icon which indicates that activities have an appropriate map. To access and download mapped data, visit the MND Data Visualization Tool, Earth System Data Explorer.
 -
Teacher Preparation:
-
Print copies of the cube on cardstock and cut out. Assemble the cube with glue. Note: consider laminating after you cut these out for multiple uses. (Gaming dice may be substituted for the cubes.) Also, print off copies of the differentiated Map Cube Questions. Distribute to students for group or independent work
-
Procedure
- Distribute one Cube per group, as well as the differentiated Map Cube Question sheets, and mapped images.
- Students roll the cube and find the matching question on the Map Cube Question sheet.
- Answer one question found under matching question on a sheet of paper, labeling the question with the number and letter of the question.
- Repeat Steps 2-4 until at least 10 are answered.
Disciplinary Core Ideas:
Crosscutting Concepts:
- Patterns
- Cause and Effect
- Scale, Proportion, and Quantity
- Systems and System Models
- Stability and Change
Science and Engineering Practices:
- Analyzing and Interpreting Data
- Constructing Explanations and Designing Solutions
- Engaging in Argument from Evidence
- Obtaining, Evaluating and Communicating Information
- observe and interpret physical characteristics of the Earth System using maps of NASA data
- analyze how the phenomena changes of time and space
- brainstorm the phenomena connects to other parts of the Earth System
- identify patterns and relationships in data
- How are the data represented in the model?
- How do we identify a change in these data?
- Where on Earth were these data collected?
- When were these data collected?
- What areas have high and low values? Why?
- What other questions do you have about the map?

Grade Band
- 3-5
- 6-8
Time
- 30 minutes
Visualization Tool
NGSS Three Dimensional Learning
- See drop-down menu at the bottom of the page