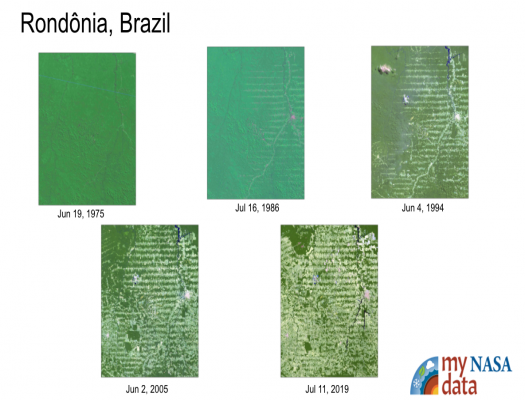
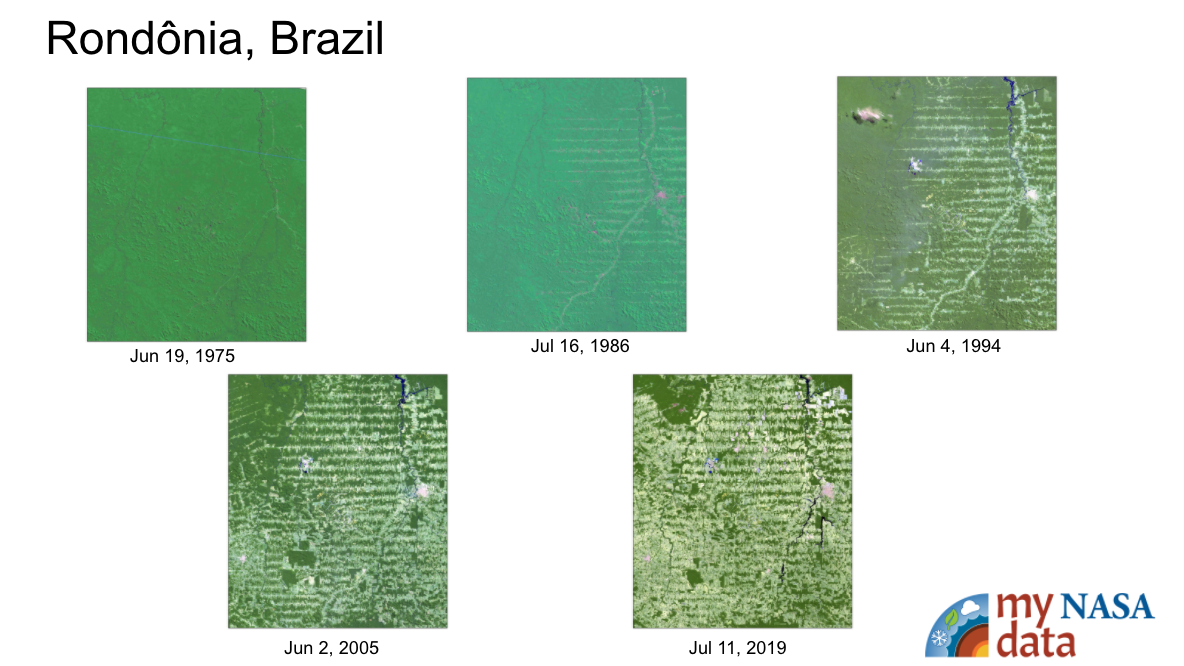
White biosphere icon
Just one moment,
loading Biosphere...

Featured Lesson Plans

Grade Level: 6-8, 9-12

This investigation introduces students to the significant environmental changes occurring around the world. The investigation uses NASA satellite images of Brazil to illustrate deforestation as one type of environmental change.

Grade Level: 6-8, 9-12

Students identify and classify kinds of land cover (such as vegetation, urban areas, water, and bare soil) in Landsat satellite images of Phoenix, Arizona taken in 1984 and 2018.

Grade Level: 9-12

In this 5E’s lesson, students observe maps that show smoke and AOD levels surrounding Fresno, California at the time when the 2020 Creek Fire was burning. Students construct a claim that identifies a relationship between fire-related data and air quality data.

Grade Level: 3-5, 6-8, 9-12

The Earth System Satellite Images, help the learner visualize how different Earth system variables change over time, establish cause and effect relationships for a specific variable, identify patterns, and determine relationships among variables over one year.

Grade Level: 3-5, 6-8, 9-12

The Earth System Satellite Images, along with the Data Literacy Cubes, help the learner visualize how different Earth system variables change over time, establish cause and effect relationships, identify patterns, and determine relationships among variables.