Lesson Plans
Tracking Change Over Time-Understanding Remote Sensing
Overview
This USGS activity leads students to an understanding of what remote sensing means and how researchers use it to study changes to the Earth’s surface, such as deforestation.
Materials Required
- Tracking Change Over Time: Understanding Remote Sensing - Student PDF (1.9 MB)
- Tracking Change Over Time - Teacher PDF (3.5 MB) (Answer key provided.)
Procedure
Exploring Earth's Surface
- Distribute Student Sheets and project images on the screen.
-
Ask students, "What can you see in a satellite image?"
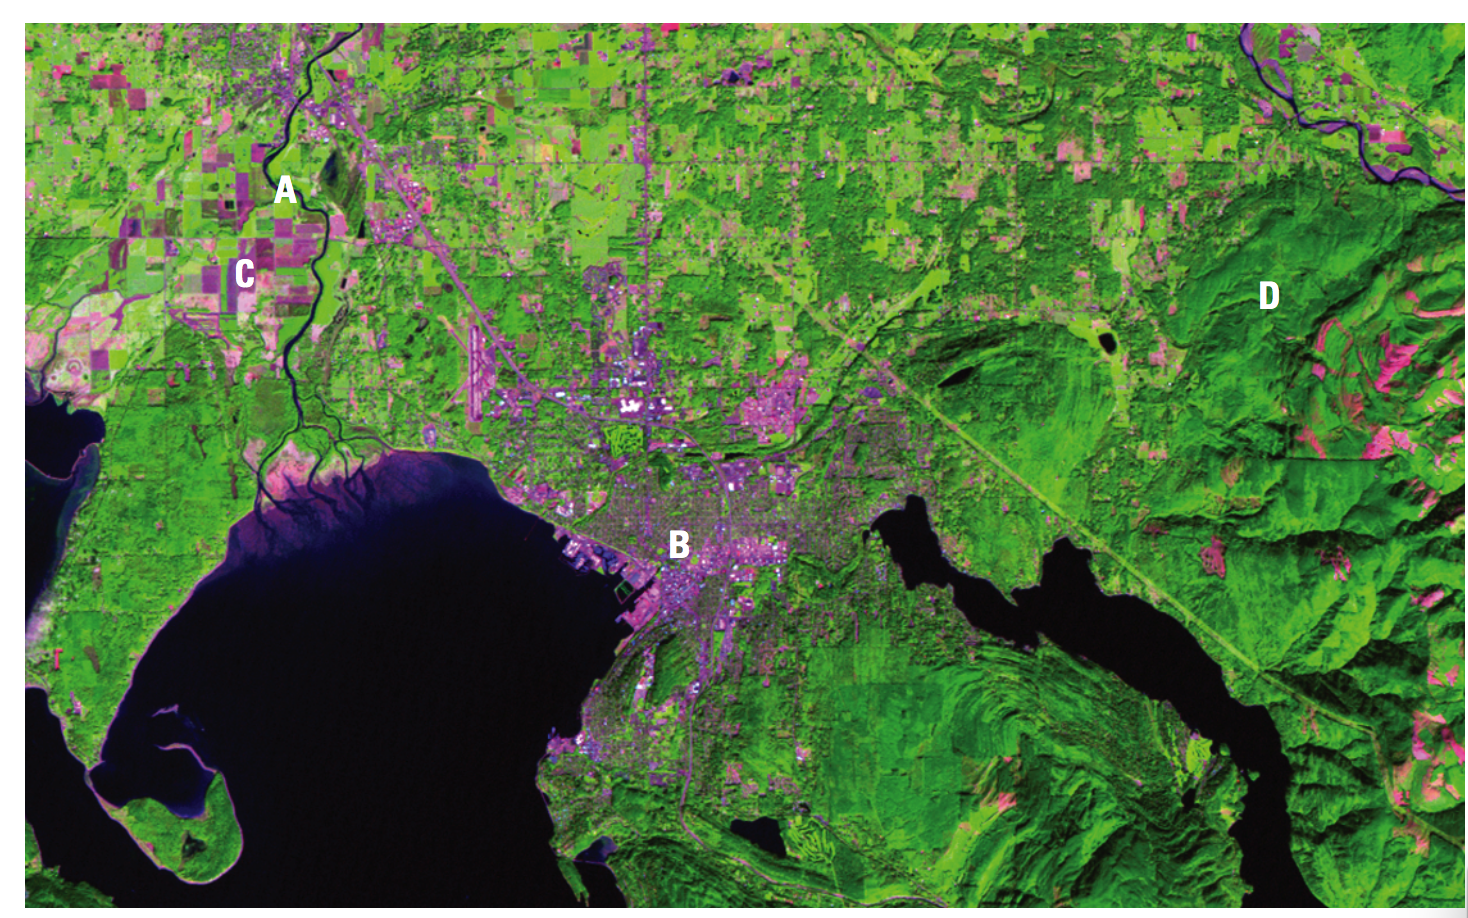
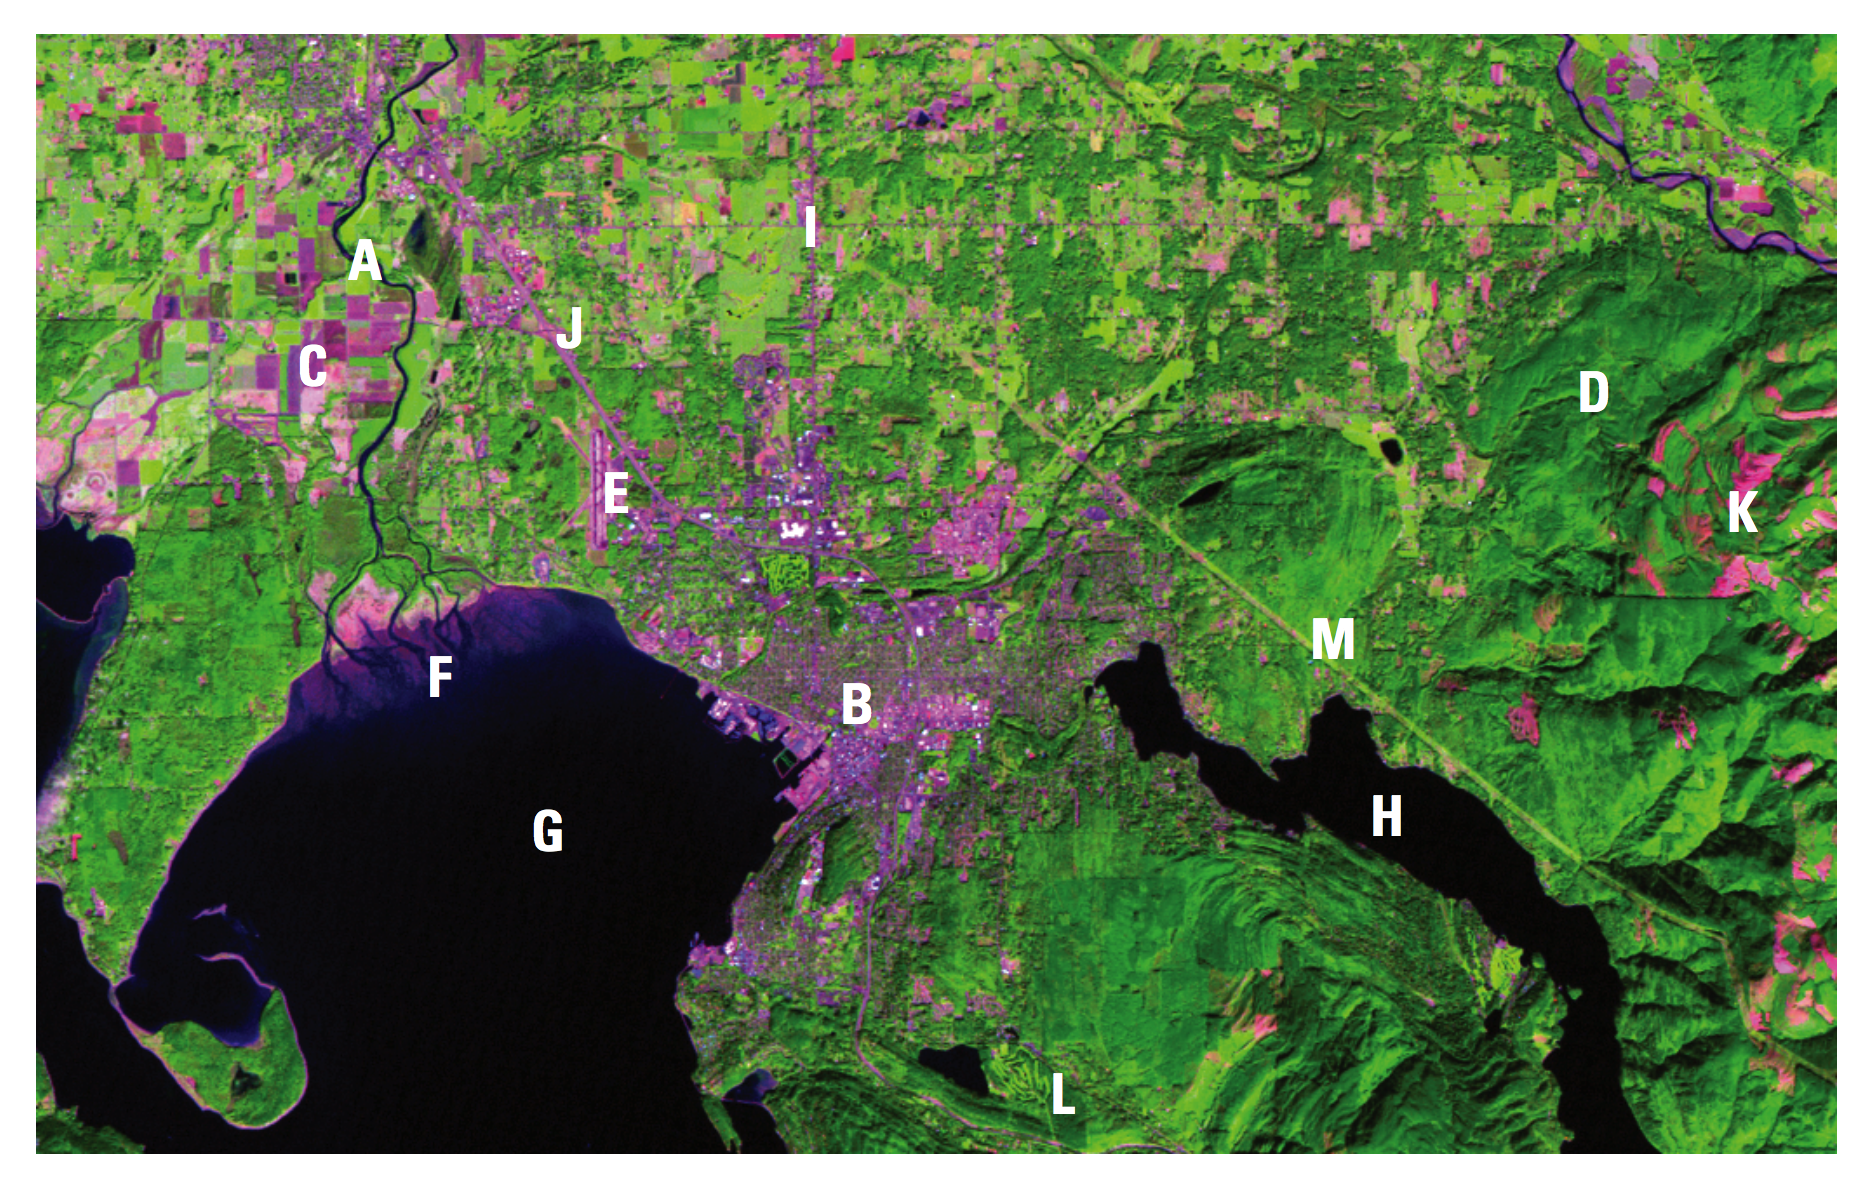
- In this image of Bellingham, Washington (below), you can see a river (A), urban areas (B), agricultural areas (C), and forest (D).
- Direct students to find the following features in the image:
- Airport E
- River sediment F
- Bay G
- Lake H
- Major streets I
- Highway J
- Logging clear-cut areas K
- Golf course L
- Cleared area for power lines M
Identifying Changes over Time
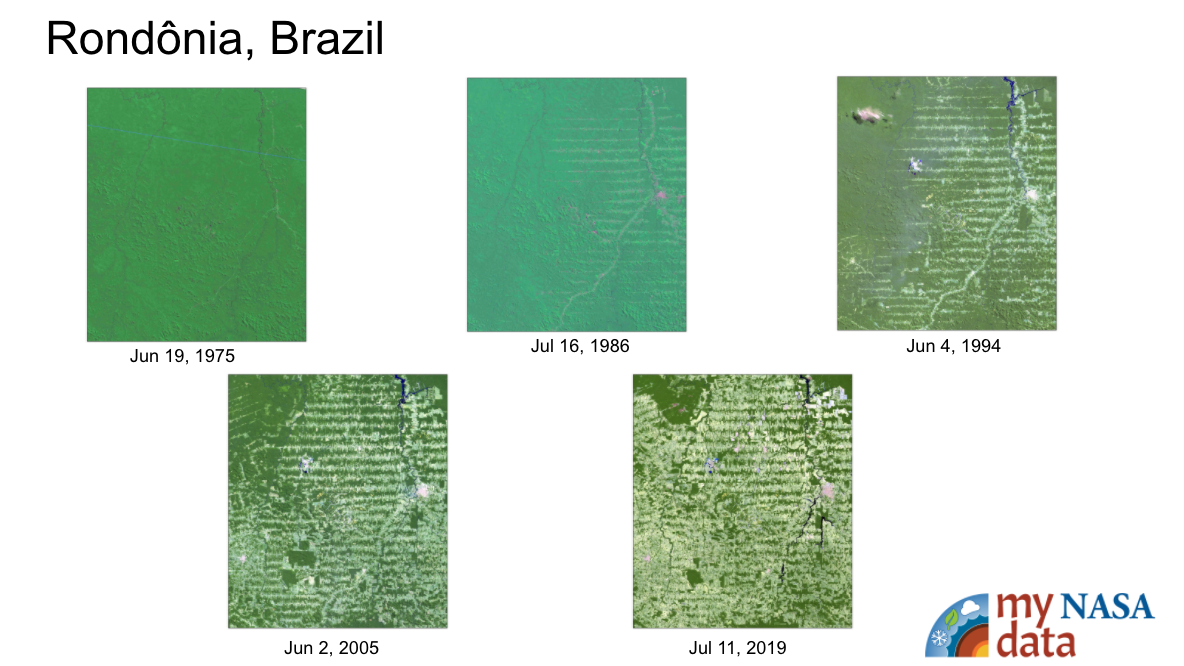
The Landsat satellite image collection is valuable because it shows change over time of the Earth’s land surfaces.
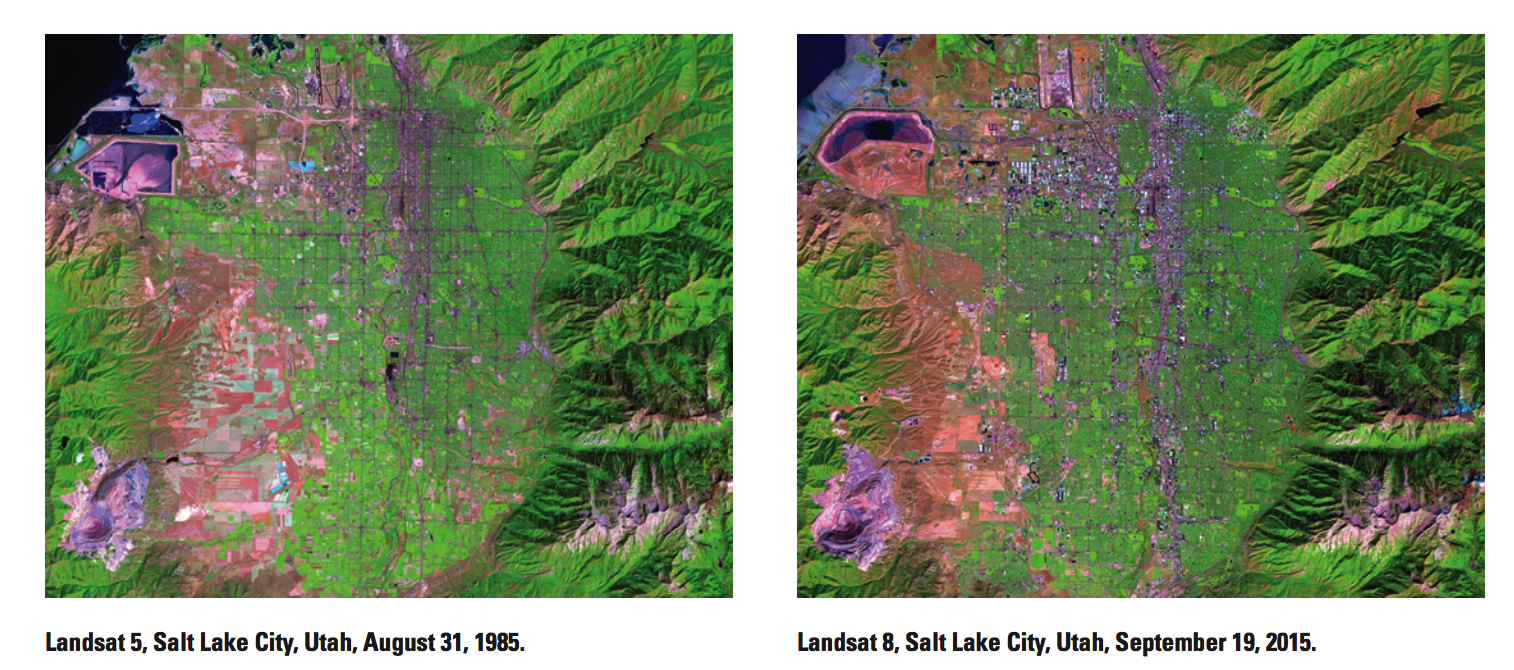
- Look at these two images and find at least five things that have changed between the two time periods.
Possible answers may include:
- Salt Lake City International Airport, top center, has changed, especially the addition of a runway on the west side.
- Numerous urban areas have expanded, especially to the west and southwest.
- The 2015 image contains several more golf courses than the 1985 image. See if students can locate a few of them.
- In the northeast corner of the images, a new lake appears the Little Dell Reservoir.
- In the southwest corner of the images is the Bingham Canyon Open Pit Copper Mine, the largest man-made excavation in the world. Some expansion to the mine can be seen on the north side of the pit.
- The large pink and blue shape in the northwest corner of the images is the tailings pond for the copper mine. Tailings are the waste left over from refining the copper. This is a continuously changing landform.
- Ask students what other changes they notice.
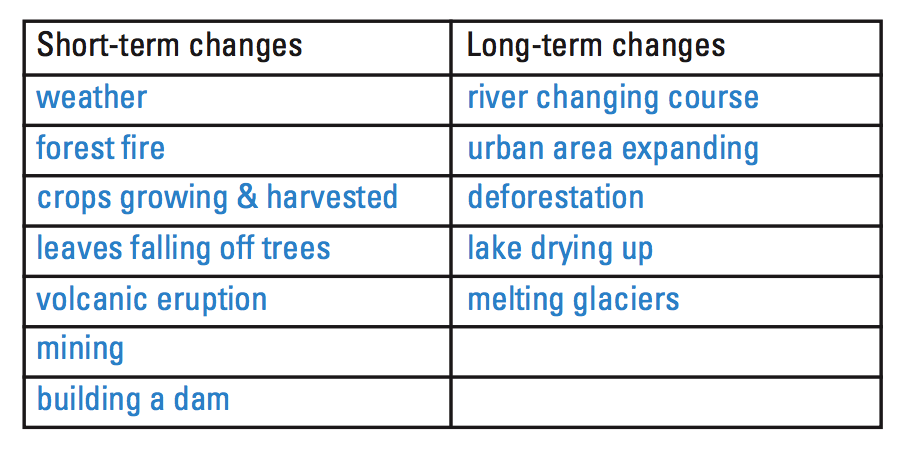
2. Brainstorm examples of short-term and long-term changes to the Earth’s surface and complete the table. Ask students for their ideas and record them on the board.
3. In Think-Pair-Share, have the students address the following questions and then share answers for class discussion: 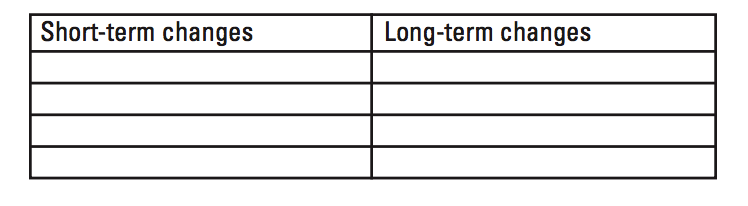
- Which of these changes are likely to affect your life and why?
- How could these changes be studied? (Visiting the site to see the change, satellite images, reading about the place.)
- What are the advantages and disadvantages of how these changes can be studied? (Some ideas to address: Visiting the site can be costly and in some cases impossible—the location could be too remote. Visiting the site only lets you see a small area; satellite images allow you to see more area.)
- How can images from remote sensing satellite sensors help us study landscape changes on the Earth’s surface? (People can see large areas and observe how a place changes over months, years, or decades.)
Measuring Earth's Surface
 The resolution of the Landsat satellite data we are using is 30 meters. That means one pixel is equal to a square 30 meters by 30 meters, which is about the size of a baseball diamond. For example, one Landsat 5 image contains about 35 million pixels—that’s about 35 million baseball diamonds! Consider having the students measure off a 30x30-meter area to show the size of the surface area of one Landsat pixel. For this exercise, the classroom may be too small and you may need to use the gym or the schoolyard. This exercise helps the students directly visualize the size of a Landsat pixel.
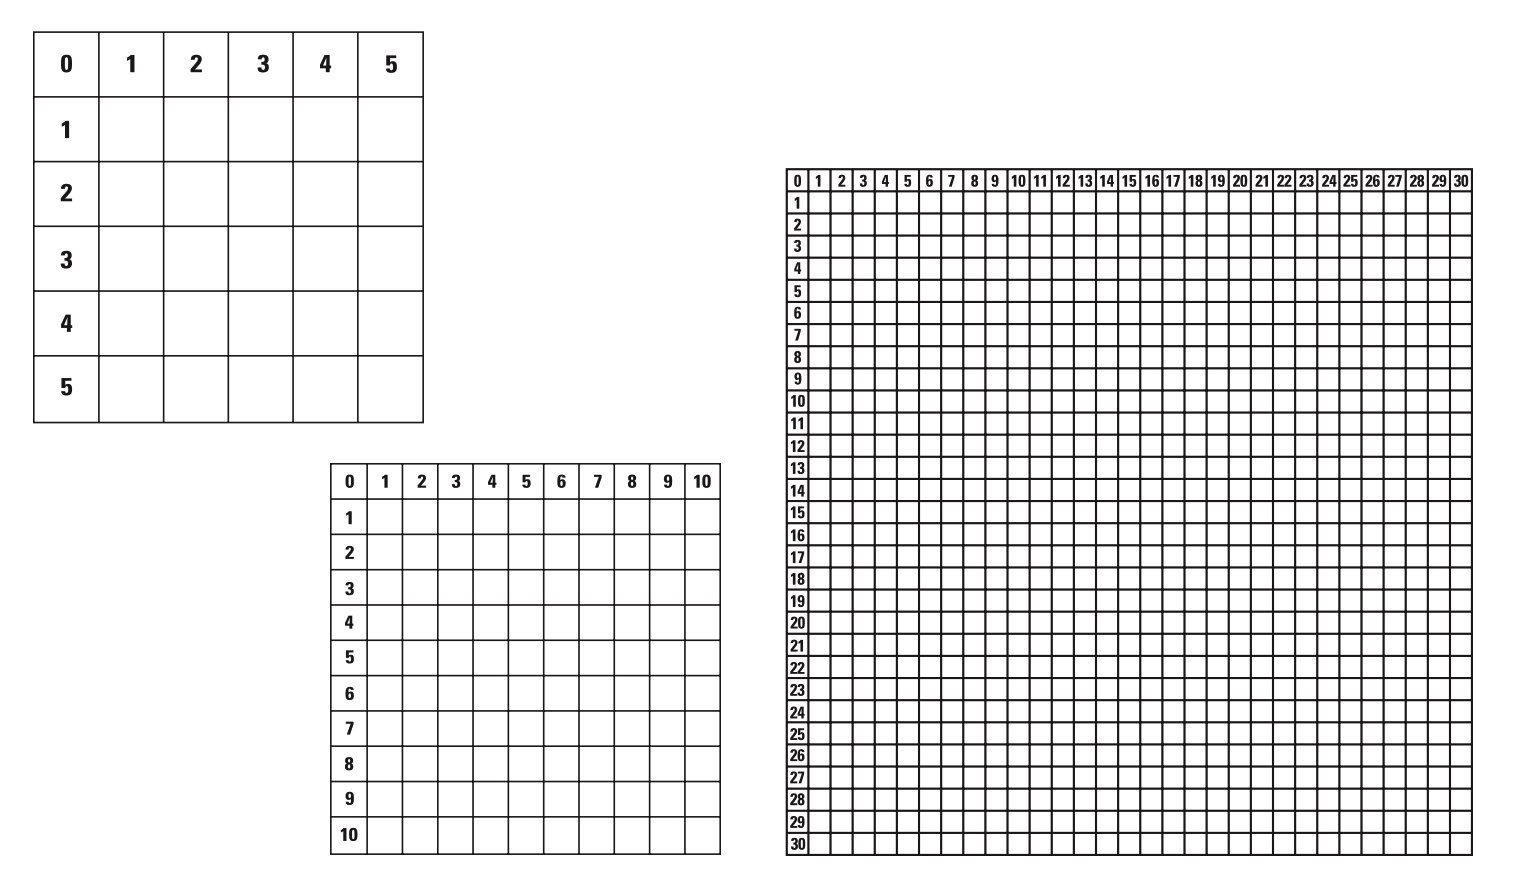
Let’s see how a low-resolution image compares to a high-resolution image.
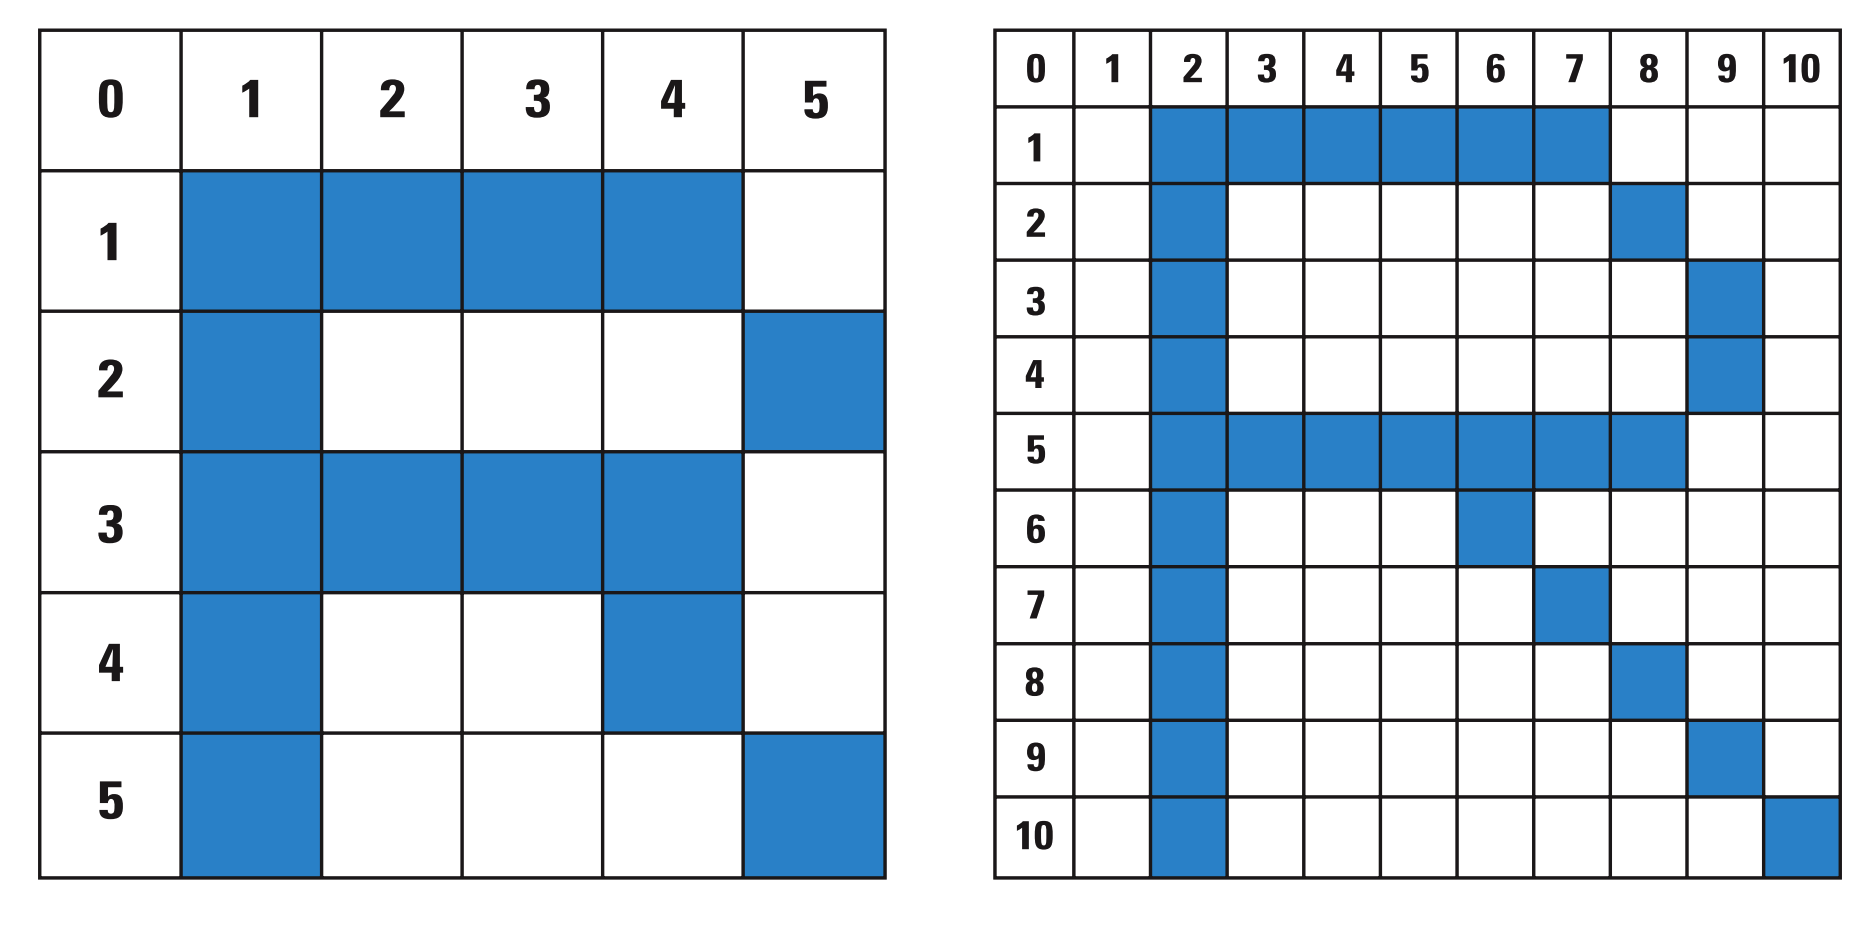
- On the blank grids, try to create the letter R on the 5x5 grid. Only whole squares may be used; no diagonals or partial filling allowed. How well does this work?
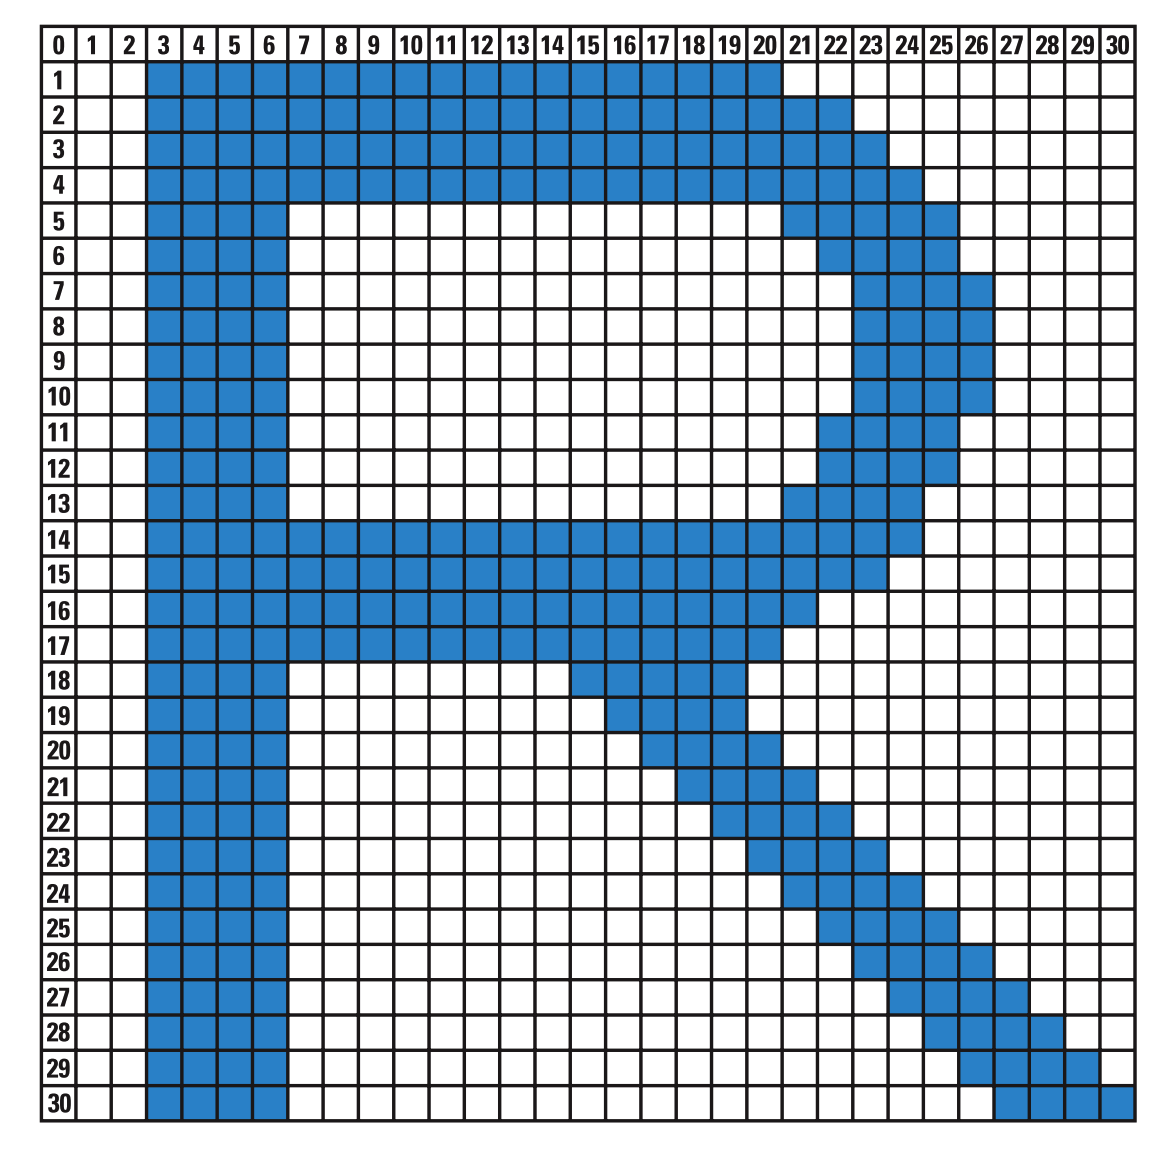
- Try a grid with more squares/pixels. Which grid works best for this task, the 5x5, 10x10, or 30x30? Which one produces the best picture?
Ask the students to explain why the set of smaller blocks produced a better image. Students should recognize that the smaller the amount of space in a pixel, the sharper the final image will be. But note that the image with small pixels took a lot more work and time to complete. So we need a happy medium—enough detail to be able to observe landscape change but not too much that it is impractical to work with. The 30-meter resolution of Landsat is that happy medium.
The 30-meter resolution of Landsats 7 and 8 works well for observing landscape changes over time. Bigger pixels wouldn’t provide enough detail, and smaller pixels would be too much data to be practical to work with. Remote sensing scientists refer to this as moderate resolution. Other Earth-observing satellites, such as NASA’s Terra and Aqua satellites, have lower resolutions, up to 1 kilometer. And France’s Satellite Pour l’Observation de la Terre (SPOT) has higher resolutions, up to 2.5 meters.
Disciplinary Core Ideas:
- PS4A: Wave Properties
- ESS3A: Natural Resources
- ESS3B: Natural Hazards
- ESS3C: Human Impacts on Earth Systems
Crosscutting Concepts:
Science and Engineering Practices:
- Analyzing and Interpreting Data
Students will
- Learn how sensors onboard Earth-observing satellites work and how to identify features in a satellite image.
- Learn about the history of the Landsat satellites.
- Investigate how pixels and resolution relate to satellite imagery.
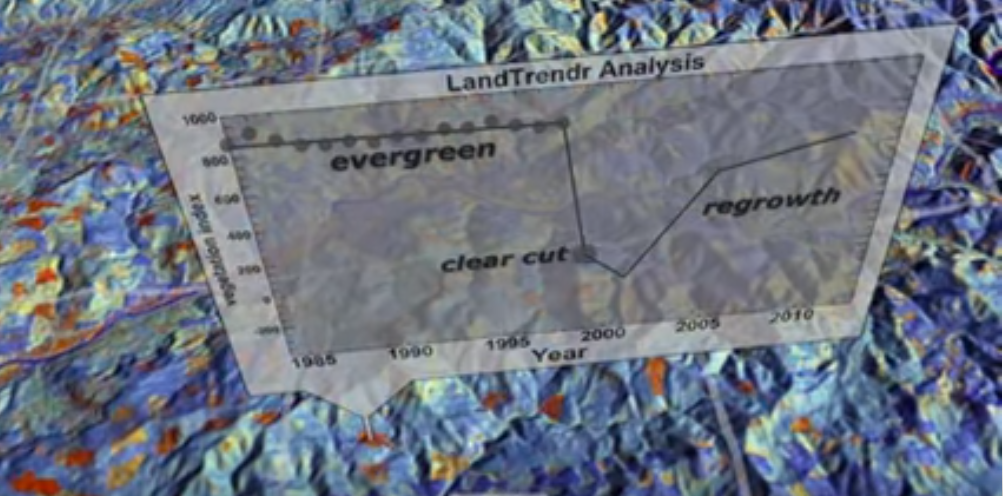
- Use the tools that scientists use to analyze and interpret satellite imagery to investigate changes over time.
- How does the Earth's surface change over long and short-term periods of time?
- How can images from remote sensing satellite sensors help us study landscape changes to Earth's surface?
- How do scientists observe and measure deforestation and other changes to the Biosphere, like forest fires, crop growth and harvest, seasonal cycles of plants, and others?
- How do these changes affect your life and why?
1. What is remote sensing?
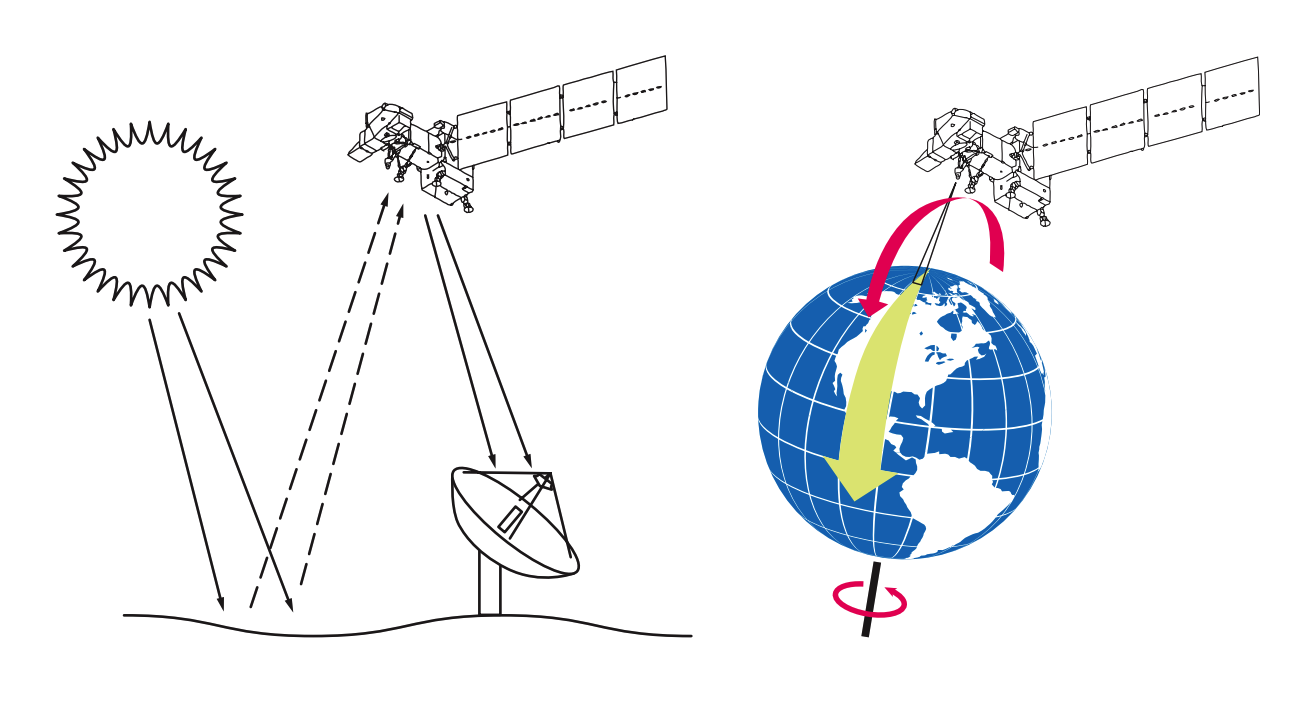
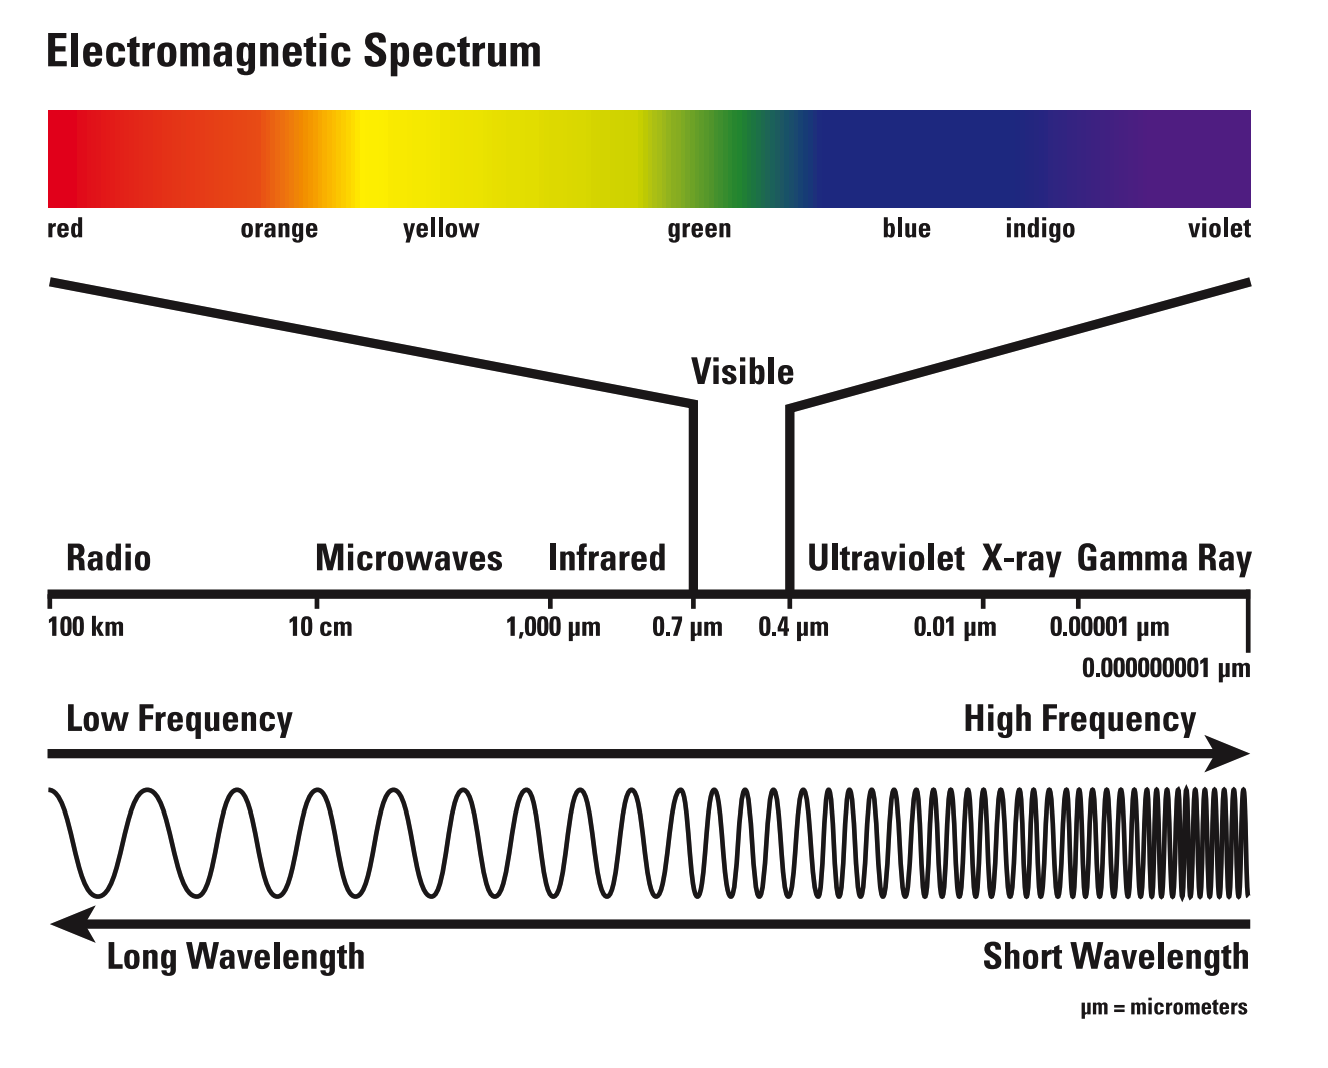
Remote sensing means observing something from a distance. Satellites in space observe the Earth from a distance and help scientists study large tracts of land and how that land changes over time. Optical remote sensing satellites use reflected light to detect electromagnetic energy on the Earth’s surface. The level of energy is represented by the electromagnetic spectrum, which is the range of energy that comes from the Sun or any other object in the Universe. The light from the Sun that we can see is only a small part of the electromagnetic spectrum and includes the colors of the rainbow. Satellite sensors can detect light that we can’t see.
The electromagnetic energy reflects off the Earth’s surface and up to the satellite sensor, which collects and records information about that energy. That information is transmitted to a receiving station in the form of data that are processed into an image. While there are many Earth-observing satellites, these lessons focus on the Landsat series of satellites. The Landsat satellites are in a polar orbit, which, along with the Earth’s rotation, allows them to image most of the Earth. As a Landsat satellite revolves around the Earth, its sensor “sees” a certain portion of the Earth’s surface. As the satellite orbits the Earth from pole to pole, it appears to move from east to west because of the Earth’s rotation. This apparent movement allows the satellite to view a new area with each orbit.
2. How do satellite sensors work?
We can only see an object because light bounces off of it and to our eyes. Human eyes can detect only visible light—the colors of the rainbow. Satellite sensors can also detect ultraviolet and infrared light. The sensors record this information in different portions of the electromagnetic spectrum, which is measured in wavelengths. Landsat satellite sensors detect both visible and infrared light. When satellite images are made, these “invisible” types of light are assigned visible colors to represent them. That is why some satellite images have strange colors.
American Association for the Advancement of Science (AAAS) Benchmarks
- Physical Setting/Processes that Shape the Earth/ Interdependence of Life; Use of Earth’s Resources; Weather and Climate (4C/M7) Human activities, such as reducing the amount of forest cover, increasing the amount and variety of chemicals released into the atmosphere, and intensive farming, have changed the earth’s land, oceans, and atmosphere. Some of these changes have decreased the capacity of the environment to support some life forms.
National Geographic Education Standards
- Standard 14: “Environmental modifications have economic, social, and political implications for most of the world’s people. Therefore, the geographically informed person must understand the reasons for and consequences of human modifications of the environment in different parts of the world.”
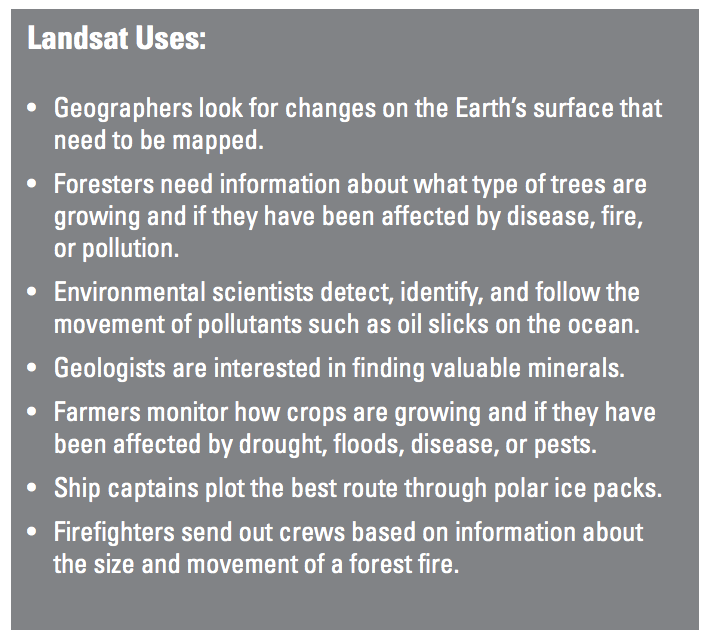
Since 1972, the Landsat series of Earth-observing satellites have been imaging Earth’s land areas. Landsat represents the world’s longest continuously acquired collection of space-based moderate resolution land remote sensing data. Landsat imagery provides a unique resource for those who work in agriculture, geology, forestry, regional planning, education, mapping, and global change research. Landsat images are also invaluable for emergency response and disaster relief.
The Landsat satellites are launched by NASA at Vandenberg Air Force Base, California. Once the satellite is in orbit, the U.S. Geological Survey (USGS) is responsible for processing and storing (archiving) the satellite data. The USGS Earth Resources Observation and Science (EROS) Center in Sioux Falls, SD, archives and distributes the satellite data.
The two Landsat satellites currently operating are Landsat 7 and Landsat 8. They are in a polar orbit 705 kilometers (438 miles) above the Earth’s surface. They complete 1 orbit every 99 minutes, for 14 ½ orbits per day. This means it takes 16 days for each satellite to obtain imagery over the entire globe.
Credit: USGS
- Teacher computer/projector only
Complementary Lesson Plans
Complementary Mini Lessons


Grade Band
- 6-8
Time
- 90 minutes
Visualization Tool
NGSS Three Dimensional Learning
- See drop-down menu at the bottom of the page