Grade Level: 6-8,
9-12
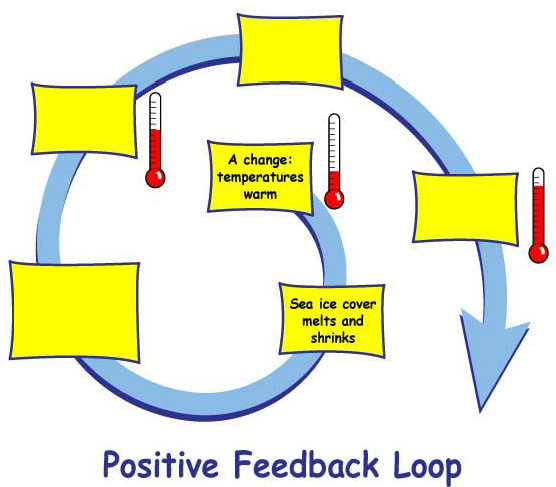
Students explore positive feedback effects of changing albedo from melting Arctic sea ice.
When sunlight reaches the Earth’s surface, some of it is absorbed and some is reflected. The relative amount (ratio) of light that a surface reflects compared to the total incoming sunlight is called albedo. A surface with a high albedo will reflect more sunlight than a surface with low albedo. Surfaces with high albedos include sand, snow and ice, and some urban surfaces, such as concrete or light-colored stone. Surfaces with low albedos include forests, the ocean, and some urban surfaces, such as asphalt.


Students explore positive feedback effects of changing albedo from melting Arctic sea ice.

Students develop and test a hypothesis about how albedo affects temperature.
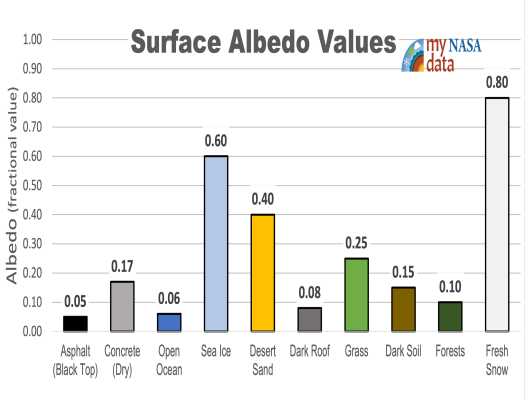
This lesson contains a card sort activity that challenges students to predict relative albedo values of common surfaces.
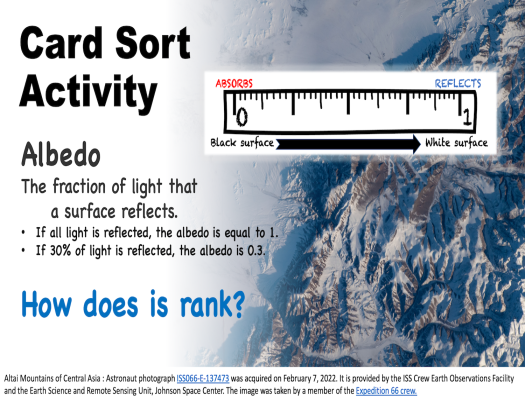
Students use albedo values of common surfaces along with photographic images of Earth taken from the International Space Station to make an argument about specific anthropogenic activities that impact Earth’s albedo.
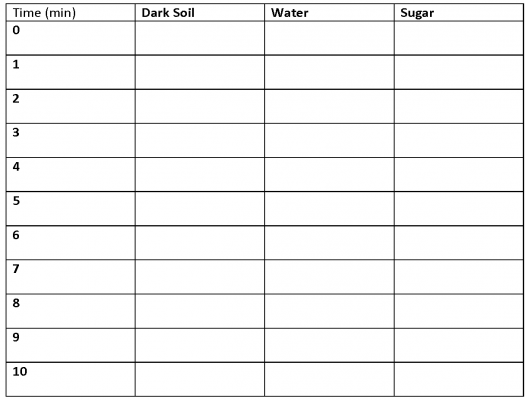
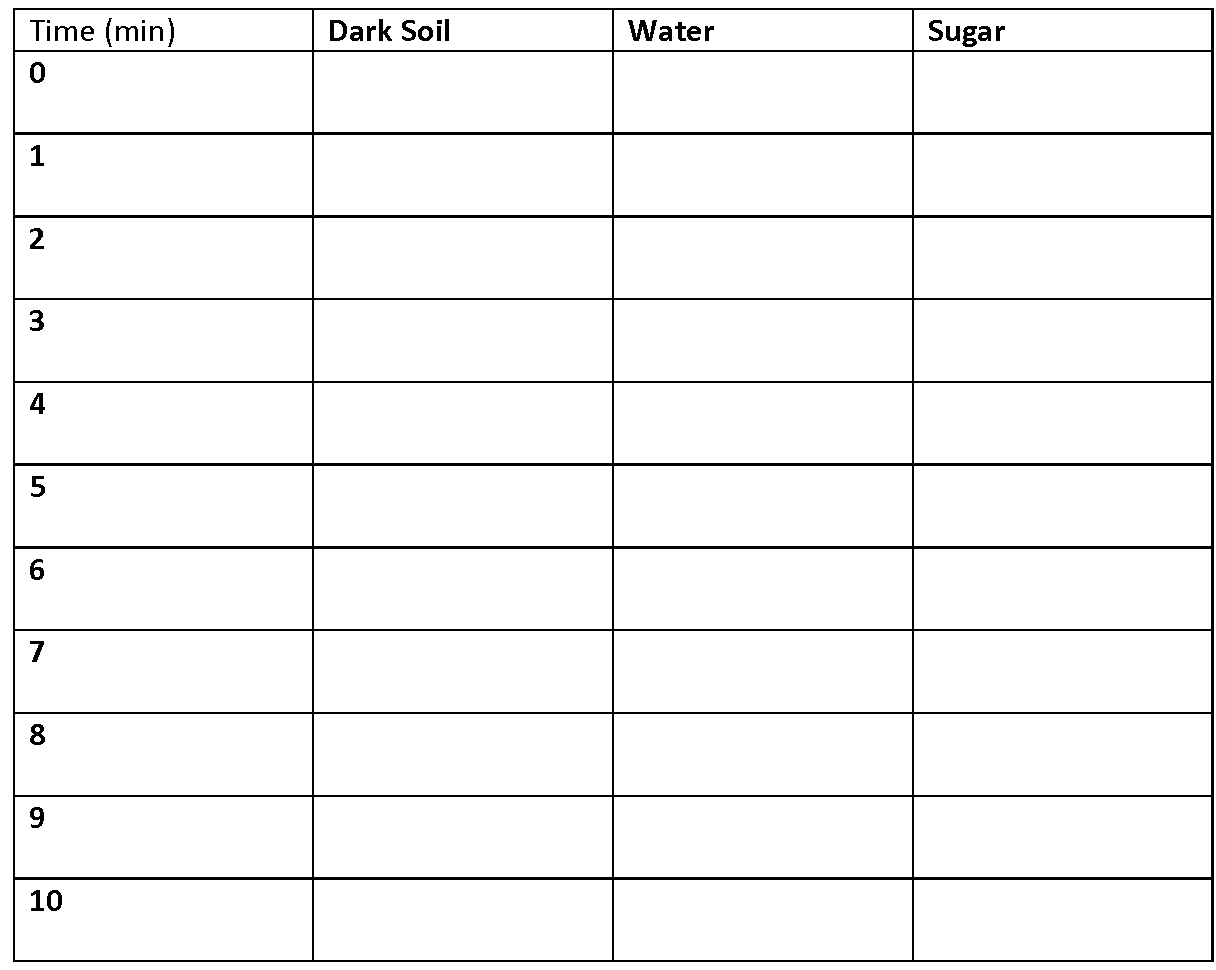
Students collect and analyze temperature data to explore what governs how much energy is reflected.
Students explore positive feedback effects of changing albedo from melting Arctic sea ice.
Students develop and test a hypothesis about how albedo affects temperature.

This lesson contains a card sort activity that challenges students to predict relative albedo values of common surfaces.

Students use albedo values of common surfaces along with photographic images of Earth taken from the International Space Station to make an argument about specific anthropogenic activities that impact Earth’s albedo.
Students collect and analyze temperature data to explore what governs how much energy is reflected.