Mini Lesson/Activity
How are Phytoplankton and Sea Surface Temperatures Related?
Overview
Students analyze and compare satellite data of Ocean Chlorophyll Concentrations with Sea Surface Temperatures, beginning with the North Atlantic region, while answering questions about the global patterns of these phenomenon.
Student Directions
Phytoplankton are microscopic, floating, plant-like organisms that live in oceans, lakes, and rivers. They use photosynthetic pigments (like chlorophyll) to convert energy from the Sun into organic matter. For this reason, NASA satellites can observe the amount of phytoplankton in the ocean by measuring chlorophyll concentrations.
Observe the Ocean Chlorophyll Concentrations and Sea Surface Temperatures maps, along with the video. Answer the following questions.
Steps:
- Check with your instructor on how to submit your answers.
-
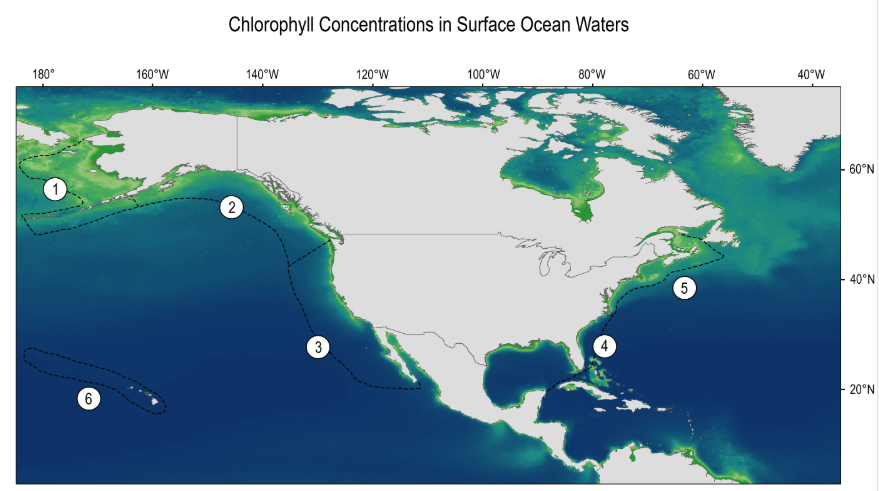
Analyze the Chlorophyll Concentrations color bar provided with the map.

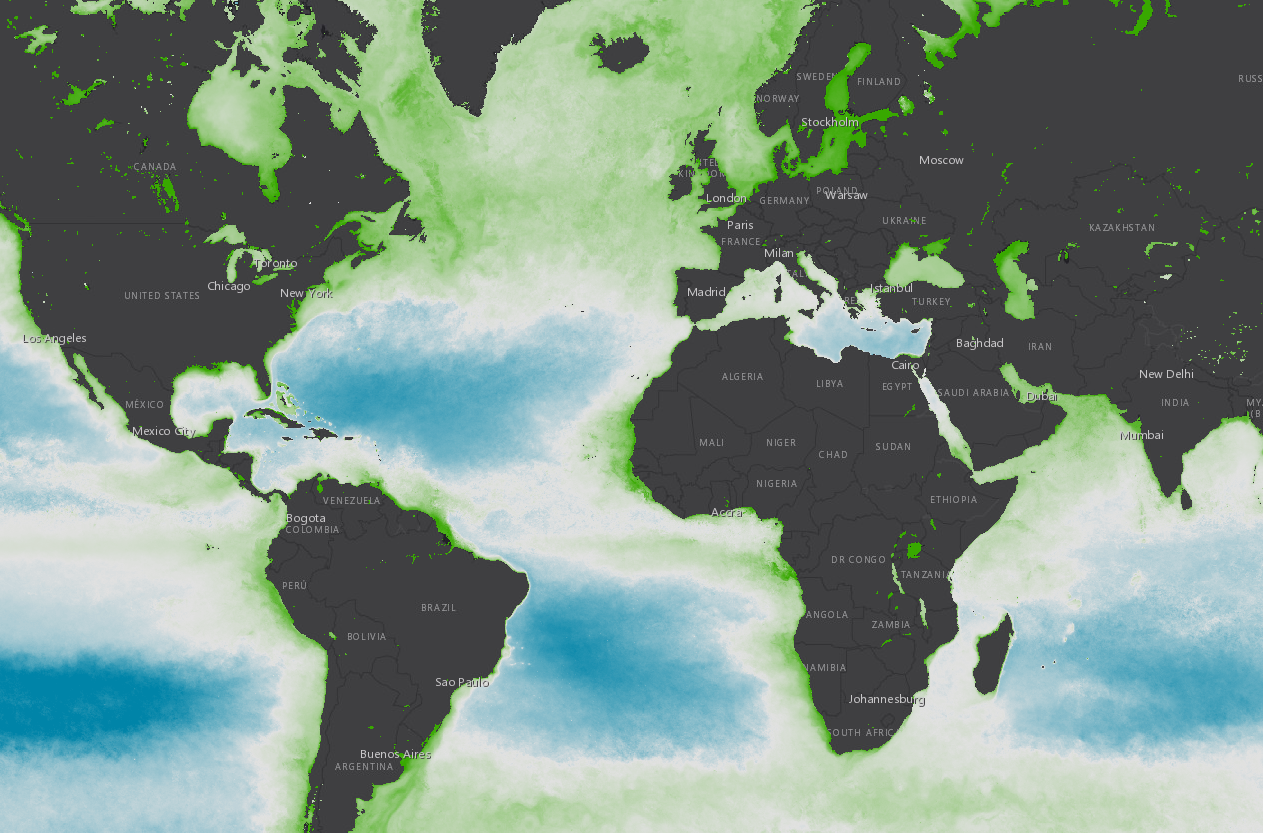
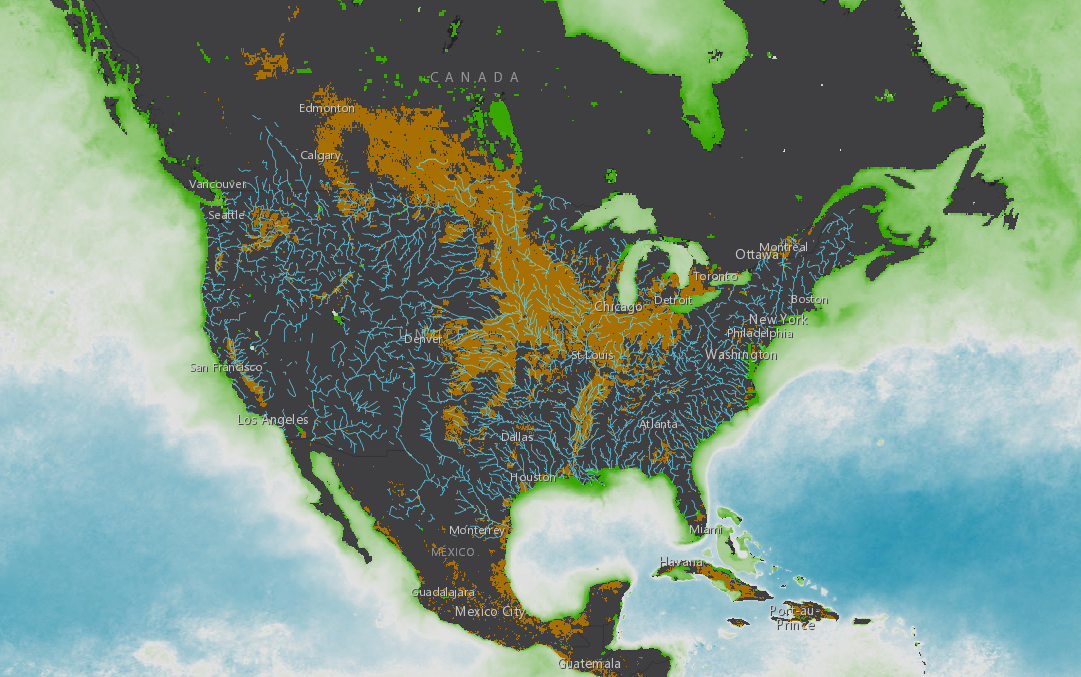
Chlorophyll Concentrations (Source: NASA Earth Observatory)
- Describe what you think the color bar legend represents.
- Describe where you observe the highest concentrations? Lowest?
- What factors do you think control where phytoplankton are distributed?
-
Now, analyze the Sea Surface Temperature mapped image, paying specific attention to the color bar provided and answer the following questions.
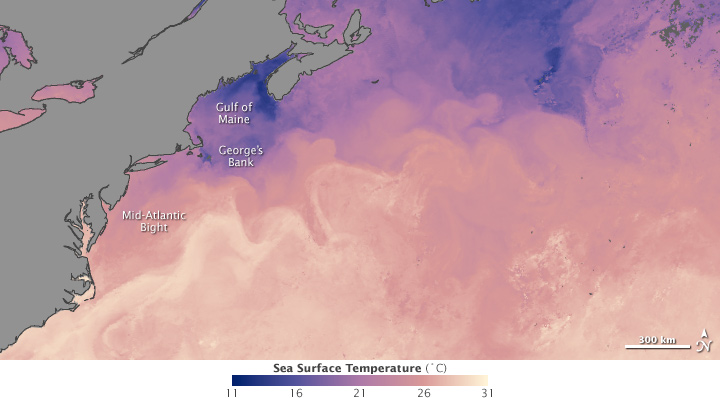
Sea Surface Temperatures (Source: NASA Earth Observatory)
- Where do you observe the highest concentrations? Lowest?
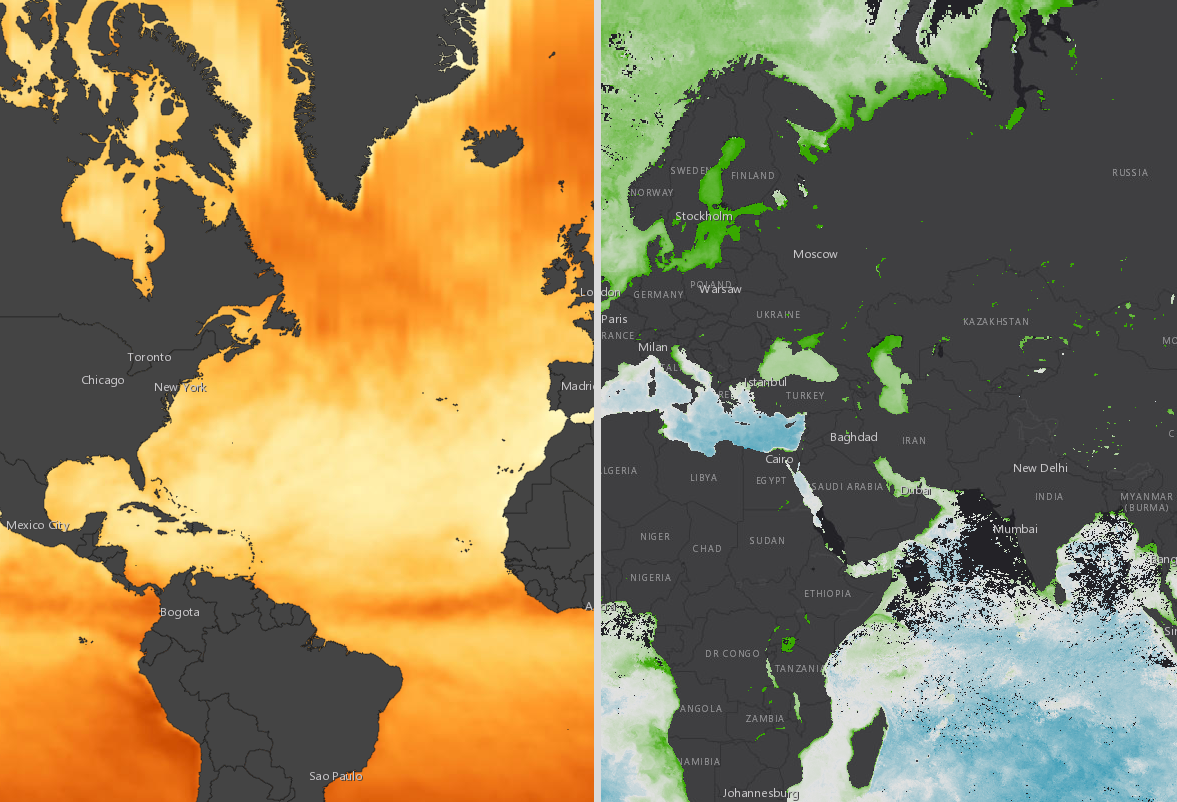
- Review the following video visualizing Chlorophyll & Sea Surface Temperature from 2002 to 2019 and answer the following questions:
- Where are the highest concentrations of chlorophyll generally located? Do the trends that you observed in the North Atlantic also occur in the Southern Hemisphere?
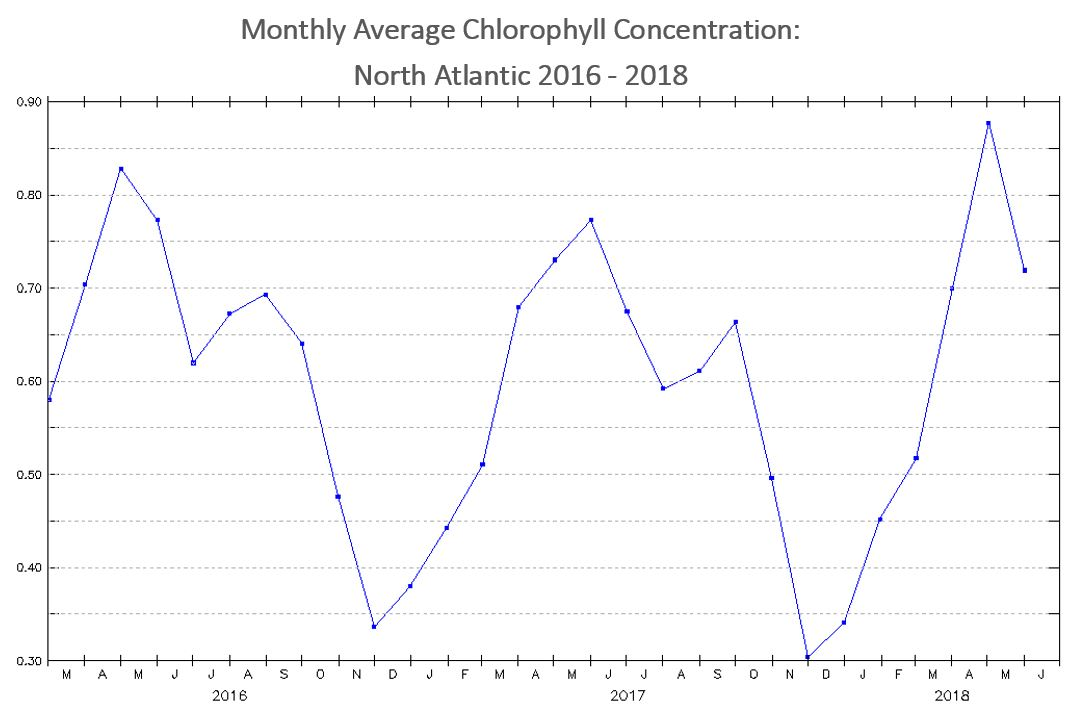
- How do the values of chlorophyll change over the seasons?
- Why do you think that the polar regions experience these changes during the spring/summer seasons?


Sources:
- As the Seasons Change, Will the Plankton? (2011, February 17). NASA Earth Observatory. Retrieved July 6, 2022, from https://earthobservatory.nasa.gov/features/OceanProductivity/page1.php
- Chlorophyll & Sea Surface Temperature. (n.d.). NASA Earth Observatory. Retrieved July 6, 2022, from https://earthobservatory.nasa.gov/global-maps/MY1DMM_CHLORA/MYD28M
Teacher Note
Teachers, these mini lessons/student activities are perfect "warm up" tasks that can be used as a hook, bell ringer, exit slip, etc. They take less than a class period to complete. Learn more on the "My NASA Data What are Mini Lessons?" page.
Teachers who are interested in receiving the answer key, please complete the Teacher Key Request and Verification Form. We verify that requestors are teachers prior to sending access to the answer keys as we’ve had many students try to pass as teachers to gain access.
Virtual Teachers: Make a copy of the ![]() Google Form of your choice so that you may assign it directly from your Google Drive into your Learning Management System (e.g., Google Classroom, Canvas, Schoology, etc.). Do you need help incorporating these Google Forms into your Learning Management System? If so, read this
Google Form of your choice so that you may assign it directly from your Google Drive into your Learning Management System (e.g., Google Classroom, Canvas, Schoology, etc.). Do you need help incorporating these Google Forms into your Learning Management System? If so, read this ![]() Guide to Using Google Forms with My NASA Data.
Guide to Using Google Forms with My NASA Data.
Disciplinary Core Ideas:
- LS2B: Cycles of Matter and Energy Transfer in Ecosystems
- ESS2A: Earth Materials and Systems
Crosscutting Concepts:
- Scale, Proportion, and Quantity
- Stability and Change
Science and Engineering Practices:
- Analyzing and Interpreting Data
Complementary Mini Lessons

Document Resources
Interactive Files
Grade Band
- 6-8
- 9-12
Time
- 30 minutes
Visualization Tool
NGSS Three Dimensional Learning
- See drop-down menu at the bottom of the page