Lesson Plans
Climate Change Inquiry Lab
Overview
In this lesson, students will investigate the drivers of climate change, including adding carbon dioxide and other greenhouse gases to the atmosphere, sea level rise, and the effect of decreasing sea ice on temperatures. They will become experts on one of these areas, conduct their own experiments and connect them to real-world data, and then make posters to present their findings to the class.
To start the lesson, students will think about what they have heard about climate change and look at a cartoon and graph of atmospheric carbon dioxide concentration. Then, students will be divided into expert groups looking at a few factors driving climate change – increased greenhouse gases such as carbon dioxide, melting sea ice, and the comparative effect on sea level of melting land ice versus sea ice. As they complete the labs, they will visit relevant websites to learn additional information. The labs can also serve as an introduction to the online investigation detailed in the GPM lesson Climate Change Online Interactive. To present their findings to the class, students will make posters outlining the problem they have experimented with and researched, including data from the experiment, how it relates to the real world, as well as any additional relevant data from NASA or other sources. Students can give presentations to the whole class, a small group, or display the posters for a gallery walk.
Credit: NASA GPM
Materials Required
- Computers, or printouts of activities to complete while labs run
- Poster paper and markers (or computers to create digital presentations, if preferred)
Melting Ice and Sea Level Rise
|
Sea Ice and Ocean Temperature
|
Carbon Dioxide and Air Temperature
|
|
|
|
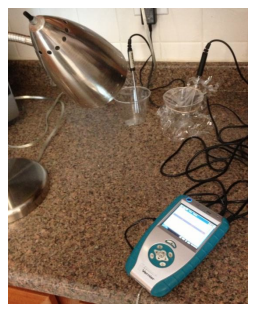
- If you can use digital thermometers or temperature probes, they will work best, as the temperature differences between the two containers in both the Sea Ice and Ocean Temperature and Carbon Dioxide and Air Temperature can be only a few degrees (or even less than a degree in some trials attempted by the author.)
- For Sea Ice and Ocean Temperature, using relatively small containers (such as cut open, quart-sized cardboard cartons) and a relatively small amount of water (200 mL in those containers), as well as insulating the outside of the containers (cloth or towels wrapped around the outside and taped on) seemed to help. If you have longer than 30 minutes to leave the experiments set up, that will also help, but do be aware of the heat generated by heat bulbs, and make sure nothing gets near the bulb to burn.
Procedure
Engage:
Use GPM Climate Change Inquiry Labs – Presentation to show students a cartoon about Santa reading a newspaper about global warming and commenting about giving out lumps of coal (slide 3). Use it as a starting point to discuss what students have heard about climate change and global warming. Next, show students a graph of atmospheric carbon dioxide measured at Mauna Loa Observatory in Hawaii (slide 4) and ask them what they observe about the graph and what might have caused the change seen. Students will probably be able to make the connection between the increasing use of cars, as well as increasing demands for electricity, often produced by coal-burning power plants. Carbon dioxide is the greenhouse gas on which humans have the most impact. While the data in the graph is from ground sources, NASA also monitors climate indicators from space.
Explore:
Divide students into groups, which will become experts on one lab investigation and share results with the larger group (slide 5-6). See the Teacher Notes section later in this document for tips on the set-up and implementation of the labs. In addition, these labs could serve as a hands-on introduction to the GPM Climate Change Online Interactive Lesson – the combination of experimentation and computer research could then be presented in the posters.
- Melting Ice and Sea Level Rise (adapted from Carlton College) Students will investigate whether melting land ice or sea ice will have a greater impact on sea level rise. For detailed instructions, see GPM Climate Change – Melting Ice and Sea Level Rise Lab. While the experiment runs, students can explore interactive maps (or printouts) of areas that might be affected by sea level rise while experiment runs.
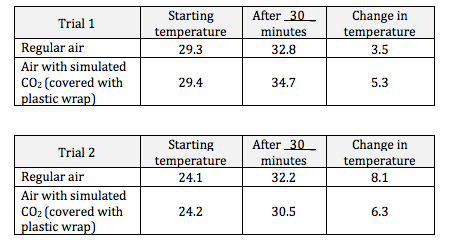
- Carbon Dioxide and Air Temperature (adapted from Glory and Global Warming Experiment and Astro-Venture Greenhouse Gases Modeling Activity, ). Students will compare the temperature increase in two containers – one simulating greenhouse gases, one without. (NOTE: The plastic wrap is representing carbon dioxide in the model used for the experiment. Greenhouse gases don’t hold in heat exactly the same way as the plastic wrap, but using various methods of adding actual carbon dioxide doesn’t produce consistent results in the small scale.) For detailed instructions, see GPM Climate Change – Carbon Dioxide and Air Temperature Lab. While the experiment runs, students can explore their own carbon footprint on two different websites, Footprint Network and Nature.
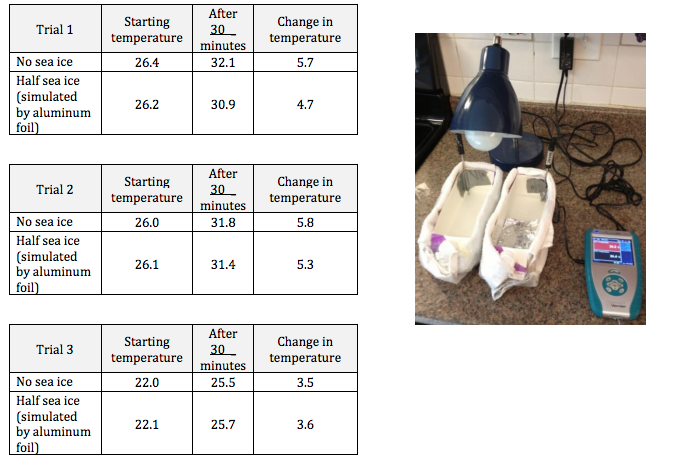
- Sea Ice and Ocean Temperature. Students will compare the water temperature in two bins – one representing open ocean after all the sea ice has melted, one partially blocked by foil, representing the reflective sea ice. For detailed instructions, see GPM Climate Change – Sea Ice and Ocean Temperature Lab. While the experiment runs, students can read information about sea ice from the National Snow and Ice Data Center and explore an interactive map of predicted Arctic sea ice and learn about Inuit terms and knowledge of sea ice.
You will likely need to duplicate the labs and have several groups complete the same experiment, depending on your class size.
- Sample results from the Sea Ice and Ocean Temperature Lab, set-up as pictured below: (200-watt incandescent bulb, about 25 cm from the top of cartons, 200 mL of water in each carton)
- Sample results from Carbon Dioxide and Air Temperature Lab, set up as pictured below: (200 watt light bulb, about 20 cm from the cups)
Explain:
After the experiments are complete, students will make posters outlining the problem they have researched – including data from their experiment, how it relates to the real world, as well as relevant data from NASA or other sources. You could have each group create a poster, or have individuals complete their own, in class or as homework. If computers are available, electronic presentations could be created instead of posters. Students should use the rubric (slide 7 and at the end of this document) to guide them as they create the posters. The GPM Climate Change Inquiry Labs – Student Capture Sheet has space for students to make notes about each of the three topics when they are presented. Depending on the time you have available, you could have each group do an oral presentation to the class, divide students into smaller groups (each with a student who completed each experiment) to share the information as experts or display the posters for a gallery walk. Also in the presentation are videos to supplement student explanations from the posters.
- A Warming World -
- (slide 8)
- Melting Ice, Rising Seas -
- (slide 9) The slides have questions for the students to think about while they watch, and there is space on the Student Capture Sheet for them to write the answers. See the notes of the PowerPoint for possible suggested answers.
Evaluate:
The rubric at the end of this document can be used to evaluate the posters.
Elaborate/Extend:
- One of the concerns with rising sea level is the increased severity of storm surges (slide 11).
- The video “NASA Real World – JASON-2” shows how the satellite, Jason 2, is able to use radar waves to determine the height of sea levels and evaluate the effects of global warming (slide 12).
- For another explanation of how NASA studies oceans, see “Climate Change and the Global Ocean” (slide 13)
- Have students calculate their water usage in addition to carbon footprint (from Carbon Dioxide and Air Temperature Lab). Several options for a website to use:
Disciplinary Core Ideas:
- ESS2D: Weather and Climate
Crosscutting Concepts:
- Cause and Effect
- Scale, Proportion, and Quantity
- Stability and Change
Science and Engineering Practices:
- Developing and Using Models
- Analyzing and Interpreting Data
- Constructing Explanations and Designing Solutions
- Engaging in Argument from Evidence
- Students will investigate the effect of simulating the addition of carbon dioxide (and other greenhouse gases) on temperature.
- Students will investigate the effect of the simulated reduction of Arctic sea ice on ocean temperatures.
- Students will investigate aspects of climate change’s drivers by conducting experiments and reporting back on what they have learned.
- What effect will carbon dioxide have on temperature?
- How does melting sea ice affect the Earth System?
The Earth's climate has changed throughout history. Just in the last 650,000 years, there have been seven cycles of glacial advance and retreat, with the abrupt end of the last ice age about 7,000 years ago marking the beginning of the modern climate era — and of human civilization. Most of these climate changes are attributed to very small variations in Earth’s orbit that change the amount of solar energy our planet receives. The current warming trend is of particular significance because most of it is very likely human-induced and proceeding at a rate that is unprecedented in the past 1,300 years.
- Visit this kid-friendly look at climate change.
- Info on Sea Ice
Teacher Notes:
- For differentiation purposes, the Melting Ice and Sea Level Rise Lab is the simplest and most foolproof, so most suited to students with the least practice with lab skills.
Earth-orbiting satellites and other technological advances have enabled scientists to see the big picture, collecting many different types of information about our planet and its climate on a global scale. Studying these climate data collected over many years reveal the signals of a changing climate.” Credit: http://climate.nasa.gov/evidence
NASA is monitoring five main vital signs of the planet: carbon dioxide, global temperature, Arctic sea ice, land ice, and sea level. “The heat-trapping nature of carbon dioxide and other gases was demonstrated in the mid-19th century. Their ability to affect the transfer of infrared energy through the atmosphere is the scientific basis of many instruments flown by NASA. Increased levels of greenhouse gases must cause the Earth to warm in response.”
Credit: NASA Climate
- For an interesting look at perceptions of climate change, see The Yale Project on Climate Change Communication.