Interactive Models
Human Impact and the Creation of Urban Heat Islands
Overview
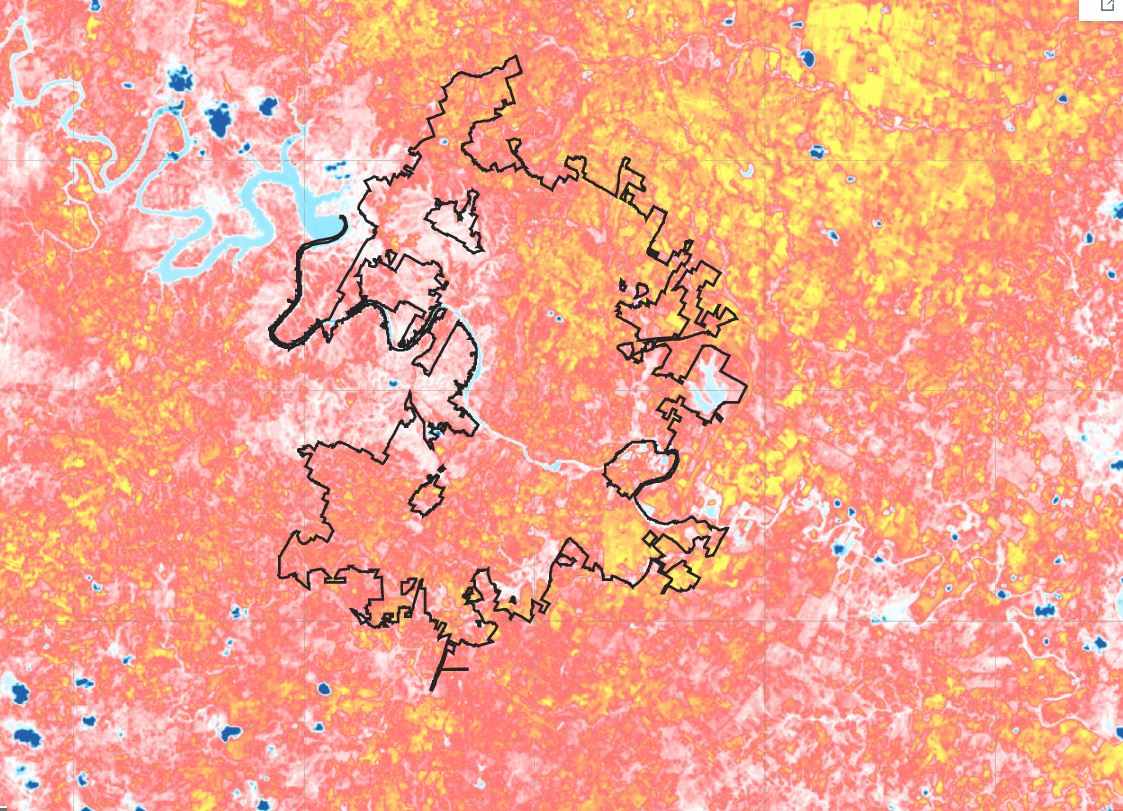
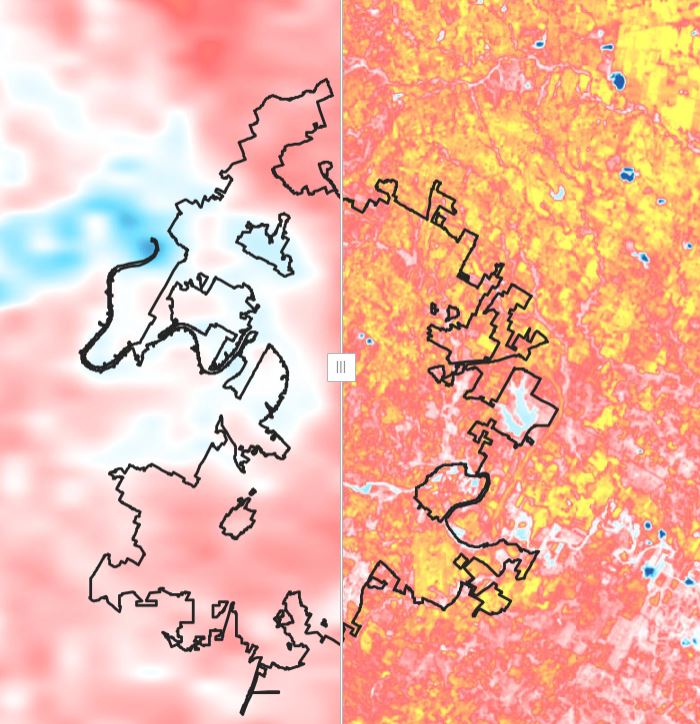
Using interactive maps, students will identify and describe the relationship between land cover classification and surface temperature as it relates to the urban heat island effect. Students will also identify patterns between population density and the locations of urban heat islands in order to describe how urbanization has contributed to the urban heat island effect.
This interactive model is one of a three-part sequence of learning experiences related to the Creation of Urban Heat Islands. To maximize optimal learning outcomes, it is suggested to complete the series in the following order:
- Human Impact and the Creation of Urban Heat Islands Interactive Model (current page)
- Patterns in Earth's Surface Temperature Interactive Model
- Exploring the Tradeoffs of Surface Temperature Models
This story map is intended to be used with students who have access to a computing device in a 1:1 or 1:2 setting.

Materials Required
Resources Needed Per Student:
- Student Data Sheet or Student Data Form (Optional)
- Computer/Tablet
- Internet Access
- Link to Human Impact and the Creation of Urban Heat Islands Interactive Model
Directions
- Using an internet accessible device, students open the link to the Human Impact and the Creation of Urban Heat Islands Interactive Model to begin their exploration of this phenomenon.
- Distribute the Human Impact and the Creation of Urban Heat Islands Interactive Model Student Sheet (optional). Have students navigate on their own through the interactive model to answer the questions and complete the activities on their student sheet.

Teacher Note
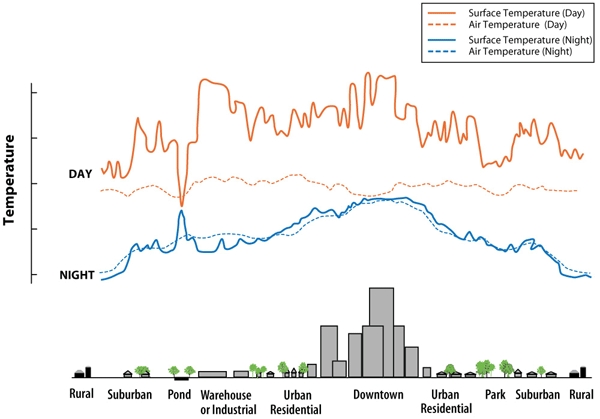
Heat islands form as vegetation is replaced by asphalt and concrete for roads, buildings, and other structures necessary to accommodate growing populations. These surfaces absorb—rather than reflect— the sun's heat, causing surface temperatures and near-surface air temperatures to rise near these surfaces. Displacing trees and vegetation minimizes the natural cooling effects of shading and evaporation of water from soil and leaves (evapotranspiration).
To learn more, visit:
- The Urban Heat Island Phenomena page for background information.
Virtual Teachers: Make a copy of the ![]() Google Form of your choice so that you may assign it directly from your Google Drive into your Learning Management System (e.g., Google Classroom, Canvas, Schoology, etc.). Do you need help incorporating these Google Forms into your Learning Management System? If so, read this
Google Form of your choice so that you may assign it directly from your Google Drive into your Learning Management System (e.g., Google Classroom, Canvas, Schoology, etc.). Do you need help incorporating these Google Forms into your Learning Management System? If so, read this ![]() Guide to Using Google Forms with My NASA Data.
Guide to Using Google Forms with My NASA Data.
Teachers who are interested in receiving the answer key, please complete the Teacher Key Request and Verification Form. We verify that requestors are teachers prior to sending access to the answer keys as we’ve had many students try to pass as teachers to gain access.
Supported NGSS Performance Expectations
- 4-ESS2-2: Analyze and interpret data from maps to describe patterns of Earth’s features.
- MS-ESS3-3: Apply scientific principles to design a method for monitoring and minimizing a human impact on the environment.
- HS-ESS3-6: Use a computational representation to illustrate the relationships among Earth systems and how those relationships are being modified due to human activity.
- Students will analyze and describe the relationship between land cover classification and surface (skin) temperature.
- Students will describe the pattern between population density and the location of urban heat islands.
- How is population density related to the location of urban heat islands?
- What is the relationship between land cover type and surface (skin) temperature?
- Describe how urbanization has contributed to the urban heat island effect.
- Internet Required
Complementary Models
Complementary Mini Lessons
Complementary Lesson Plans

Grade Band
- 3-5
- 6-8
- 9-12
Time
- 30 minutes