Lesson Plans
Flipbooks: Earth System Variables
Overview
How does the Earth System change over time?
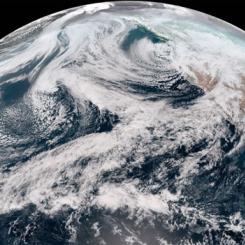
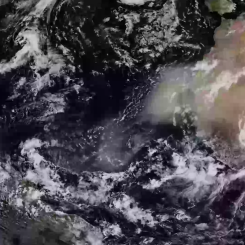
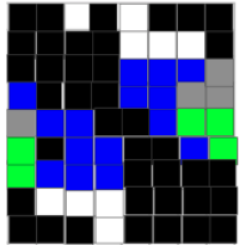
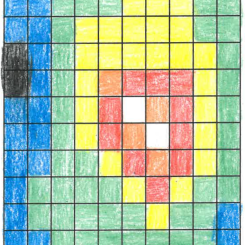
NASA visualizers take data – numbers, codes – and turn them into animations people can see and quickly understand. You can become a data visualizer by creating your own flipbook animations using maps of science variables that NASA scientists commonly study to better understand the Earth System. There are six flipbooks available for different science variables: aerosols, cloud coverage, vegetation concentrations, precipitation, incoming solar radiation, and surface temperature. Each frame in the flipbooks shows monthly averages collected in 2016 and 2017.
There are six flipbooks available for different science variables:
- aerosols
- cloud coverage
- precipitation
- solar radiation
- surface temperature
- vegetation concentrations
- Summary: includes all variables listed above
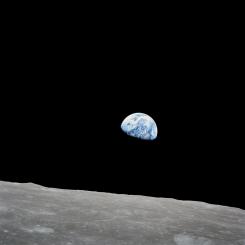
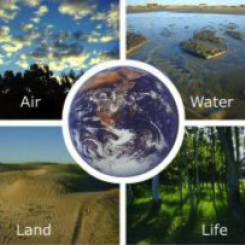
The processes in the Earth System take place in and between the Atmosphere, Cryosphere, Hydrosphere, Biosphere, and Geosphere, as well as include energy from the Sun. As we can see, Earth System processes are not bound by oceans, mountains, or country delineations–they are truly global in scope!
Materials Required
- Binder clip (small)
- Scissors
- Color PDF's printed on regular or cardstock paper
Procedure
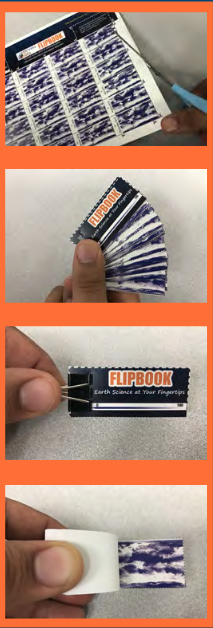
Credit: NASA/My NASA Data PRINT (in color) flipbook on paper. (One per student)
- CUT cardstock along the dotted line, making 26 frames.
- STACK the 26 frames in order. The frames are numbered.
- CLIP the stack of frames together, with the binder clip.
- FLIP through the stack quickly.
- Watch and enjoy the animation!
Looking to Scaffold Student Learning Using Data Sets like these?
- Visit the Analyzing Global Patterns with the Earth System Satellite Images page for guiding questions and pointers for engaging the learner using images like these.
- Check out the Data Cube Guide (See Map Data) for a hands-on strategy using dice/questions to guide students' data analysis.
Disciplinary Core Ideas:
- ESS2A: Earth Materials and Systems
- ESS2D: Weather and Climate
Crosscutting Concepts:
- Patterns
- Systems and System Models
Science and Engineering Practices:
- Developing and Using Models
- What do the colors in the flipbook represent?
- How does this variable change over time?
- Why do you think these changes occur?
- What is affected by these changes?
NASA satellites collect data to help unlock the unexpected wonders of how our Earth works as a system.
- Standalone Lesson (no technology required)