GLOBE Connections
GLOBE Connections: Air Quality
This resource helps to identify and access GLOBE protocols and hands-on learning activities that complement the Air Quality phenomenon.
Visit the GLOBE Atmosphere Protocols & Related ESDE Datasets page that outlines the datasets available in the Earth System Data Explorer. These data complement student GLOBE investigations using the following protocols.
Air Quality
Protocols
GLOBE protocols can be used to collect many types of data to examine air quality. Students can use the protocols to collect data and share their data with other GLOBE students around the world. As scientists continue their study air quality, they can use these data.
Atmosphere
Aerosols - Students measure the aerosol optical thickness of the atmosphere (how much of the sun’s light is scattered or absorbed by particles suspended in the air). Students point a GLOBE sun photometer at the sun and record the largest voltage reading they obtain on a digital voltmeter connected to the photometer. Students observe sky conditions near the sun, perform the Cloud, Barometric Pressure and Relative Humidity Protocols, and measure current air temperature.
Air Temperature - Students collect current air temperature is measured using a thermometer held in the open air but in the shade for at least 3 minutes.
Barometric Pressure - Students use an aneroid barometer to measure barometric pressure in support of the Cloud, Aerosols and Water Vapor Protocols.
Clouds - Students observe and report which types of clouds are visible, how much of the sky is covered by clouds, and the opacity of clouds. They also report sky and surface conditions. Each observation is matched to satellite data of clouds taken about the same time and location. Cloud observations can be taken at any time! This Protocol is designed to be flexible and fit into your schedule, classifying, observing, and reporting cloud observations when it works for you. If you observe while a satellite is overhead, you can then receive an email from NASA comparing your observations to satellite data.
Precipitation - Students determine the amount of moisture input to the local environment by measuring rain and snowfall and to measure the pH of precipitation.
Relative Humidity - Students measure the relative humidity using either a digital hygrometer or a sling psychrometer.
Biosphere
Land Cover Classification: Students determine the major land cover type at a Land Cover Sample Site.
Protocol Bundles
These protocol bundles are related to air quality.
Air Quality Bundle - Air quality is affected by a number of factors, including the source of pollutants, the type of pollutants, and local climatological and weather conditions. The quality of the air in an area has significant health impacts for both human and wildlife health. This bundle includes a group of protocols to help you better understand how air quality interacts with the various Earth spheres.
Urban Bundle - The urban environment is a reflection of urban dynamics. These dynamics include the surface and atmosphere energy balance, the transfer of air masses, the dispersion of air pollutants, and the energy/heat fluxes between the surface-atmosphere interface.
Weather Bundle - The purpose of the Weather Bundle is to suggest a group of GLOBE protocols that can provide students and teachers with an integrated knowledge of the parameters and processes which control the weather and are responsible through their changes, for weather events.
Learning Activities
Each of the GLOBE protocols has a set of learning activities to help students learn more about the instruments and procedures for the measurements, the content associated with the protocol and ways students and scientists can use the data that is being collected. There is a link for all atmosphere learning activities and those that have been selected for Air Quality are detailed below.
Phenomenon-Related Learning Activities:
The GLOBE Mission Earth Air Quality Initiative Learning Activities page has a variety of learning activities available.
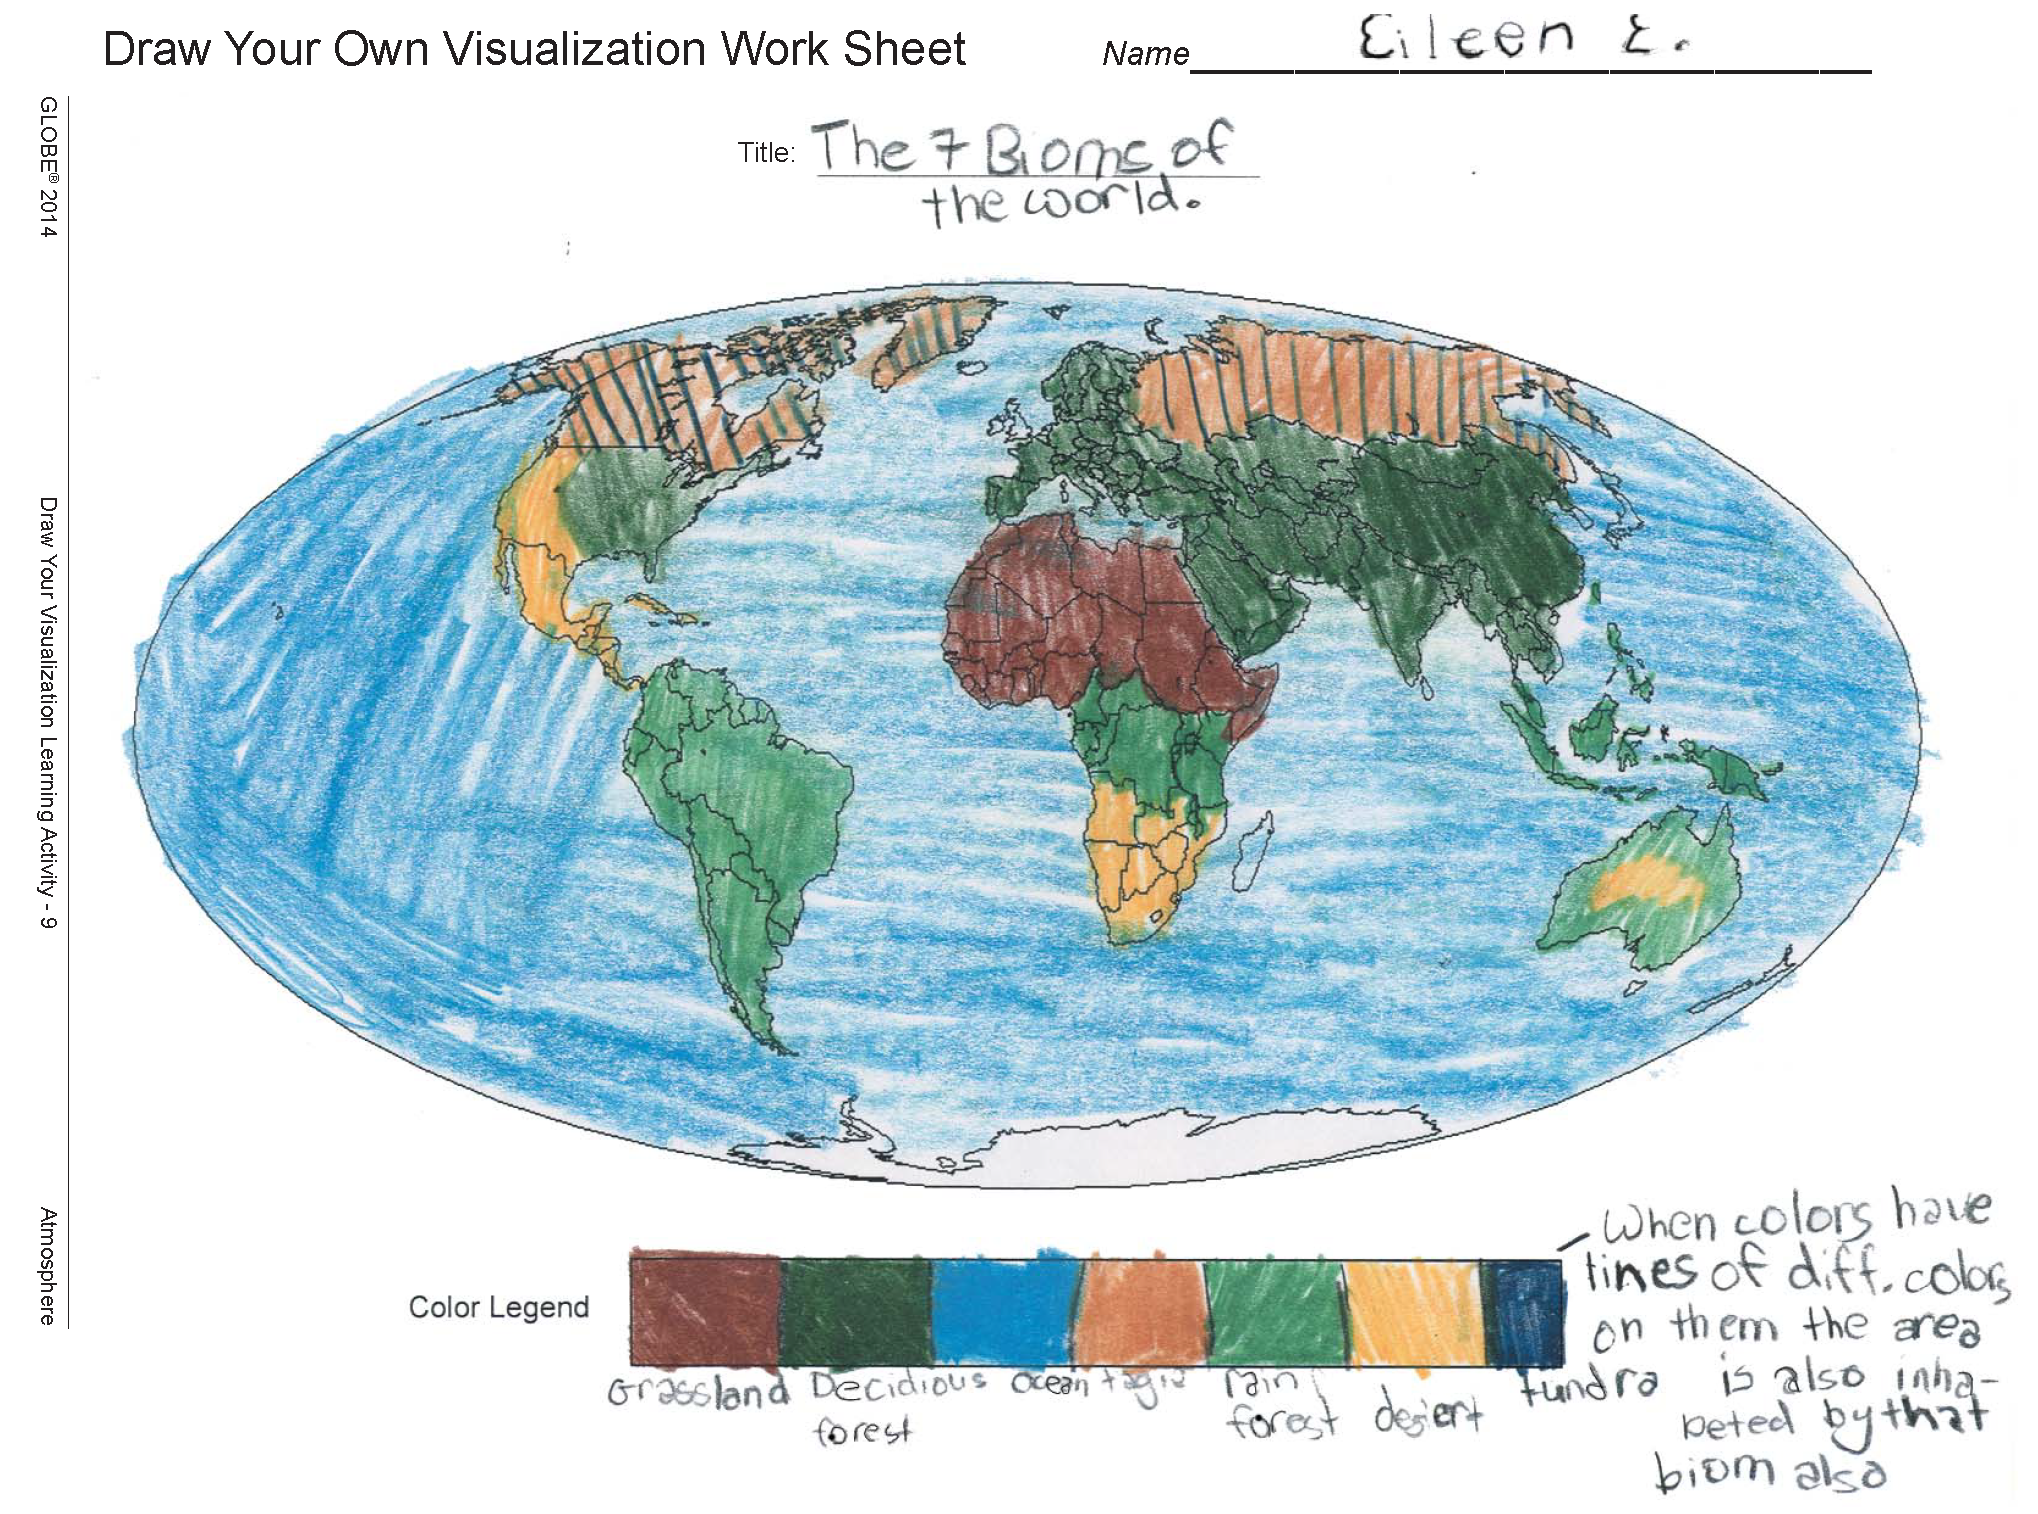
![]()
Overview: Students draw a visualization based either on their interests and ideas about the world or based on actual GLOBE data. Students are asked to justify the design choices they make and to interpret the visualizations of their peers.
 Student Outcomes:
- Visual models help us analyze and interpret data
- Geographic visualizations help organize information about places, environments, and people
See how aerosols can impact the color of the sky and the visibility toward the horizon with the Sky Conditions Activity.
Observing Sky Color and Visibility
In this activity, learners observe, document and classify changes and sky color over time to understand the relationship between sky color, visibility, and aerosols in the atmosphere.
GLOBE Educator One-Week Pacing Guide
The GLOBE Educator One-Week Pacing Guide: Air Quality provides a five day sequence of activities. It incorporates the cloud protocol and learning activities which make the connection between clouds and air quality.
Source: www.globe.gov


Sphere(s)
- Atmosphere