GLOBE Connections
GLOBE Protocol Bundle: Weather
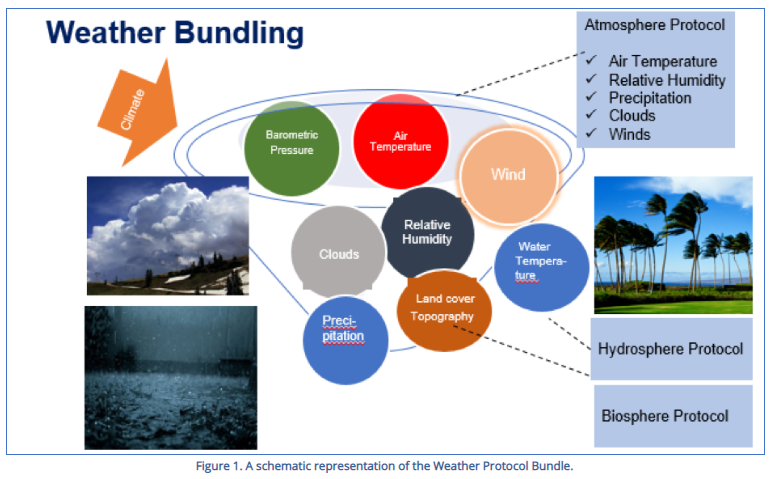
Weather
The purpose of the Weather Bundle is to suggest a group of GLOBE protocols that can provide students and teachers with integrated knowledge of the parameters and processes which control weather and are responsible through their changes, for weather events. (Source: GLOBE Weather Protocol Bundle)
Related Earth System Data Explorer data sets:
The GLOBE database provides data submitted by individuals for specific protocols which can be used in investigations. In addition, there are additional data available in the My NASA Data Earth System Data Explorer. These data can provide context and background information or provide data for additional locations. There are also data for additional parameters not included in GLOBE.
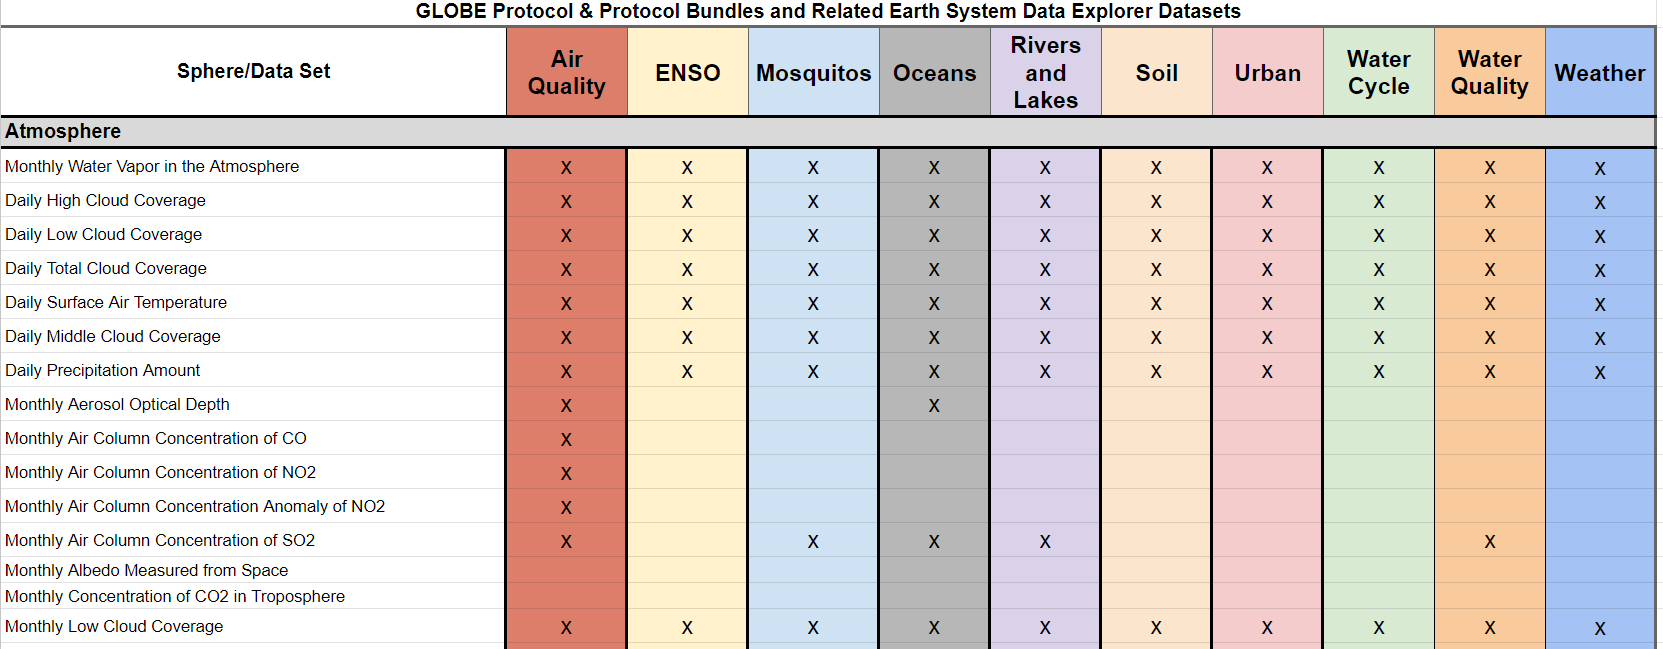
When investigating weather, there are many interrelated variables that can be explored through the Earth System Data Explorer. Some of these are directly related to a GLOBE protocol which is part of the Weather protocol bundle. Others are indirectly related. The data sets below have been identified as those that can complement these investigations. The specific GLOBE protocols used in the bundle can be found in the section below the related Earth System Data Explorer data sets section.
Explore the MND GLOBE Connections Datasets spreadsheet to review the range of datasets available to integrate with GLOBE Protocol Bundle research by visiting the link.
Dataset Recommendations and Rationale:
Air temperature and surface temperature are related to weather. Students can also research monthly surface air temperature and air temperature anomalies to help put their own data in context.
- Daily Surface Air Temperature
- Monthly Surface Air Temperature
- Monthly Surface Air Temperature Anomaly
- Monthly Daytime Surface (Skin) Temperature
- Monthly Nighttime Surface (Skin) Temperature
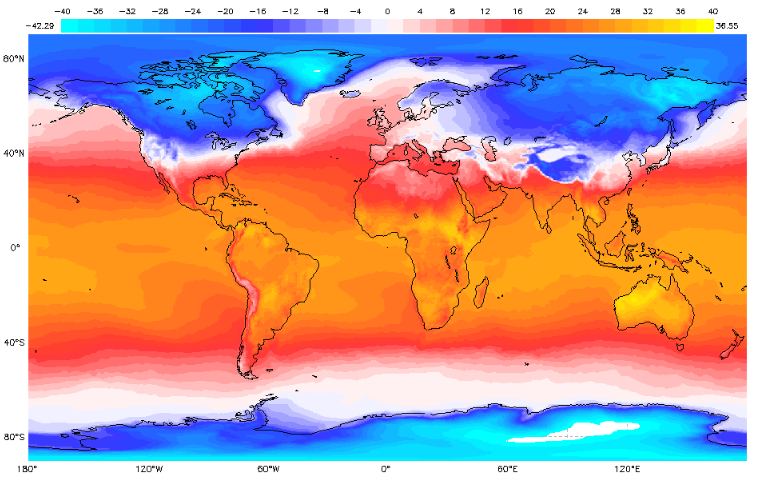
Monthly Surface Air Temperature - February 2019
Clouds are an important aspect of weather and are related to precipitation. There are precipitation (amount of snow and rain that reaches the ground) and atmospheric water vapor (the total amount of water vapor above you in the air) data which can be compared with cloud cover.
- Daily High Cloud Coverage
- Daily Low Cloud Coverage
- Daily Middle Cloud Coverage
- Daily Total Cloud Coverage
- Monthly Low Cloud Coverage
- Monthly Total Cloud Coverage
- Monthly Water Vapor in the Atmosphere
- Daily Precipitation Amount
- Monthly Average Precipitation Rate
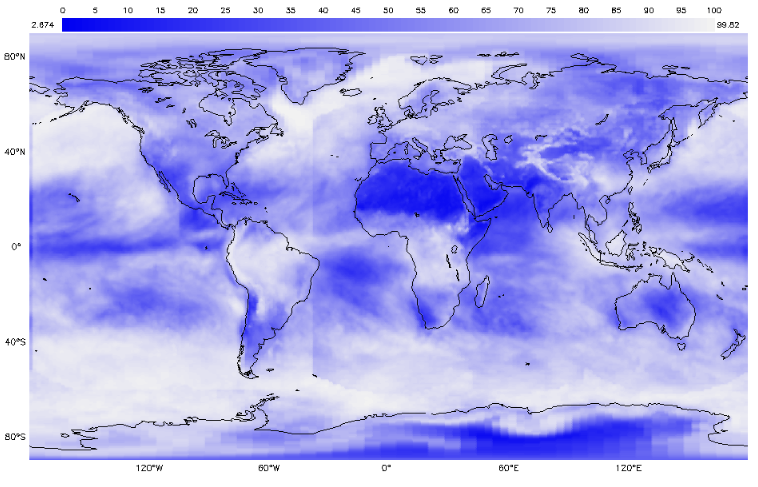
Monthly Total Cloud Cover - January 2019
GLOBE Protocols Included:
- Atmosphere
- Air Temperature - Measure the current air temperature when an instrument shelter is not available. Current air temperature is measured using a thermometer held in the open air but in the shade for at least 3 minutes.
- Barometric Pressure - Students use an aneroid barometer to measure barometric pressure in support of the Aerosols and Water Vapor Protocols.
- Clouds - Observe and report which types of clouds are visible, how much of the sky is covered by clouds, and the opacity of clouds. Also report sky and surface conditions.
- Precipitation (including pH) - To determine the amount of moisture input to the local environment by measuring rain and snowfall and to measure the pH of precipitation.
- Relative Humidity - Students measure the relative humidity using either a digital hygrometer or a sling psychrometer.
- Biosphere
- Land Cover Classification - Students locate, photograph, and determine the MUC class for 90 m x 90 m areas of homogeneous land cover.
- Hydrosphere
- Water Temperature - Students will measure the temperature of water.