GLOBE Connections
GLOBE Protocol Bundle: Urban
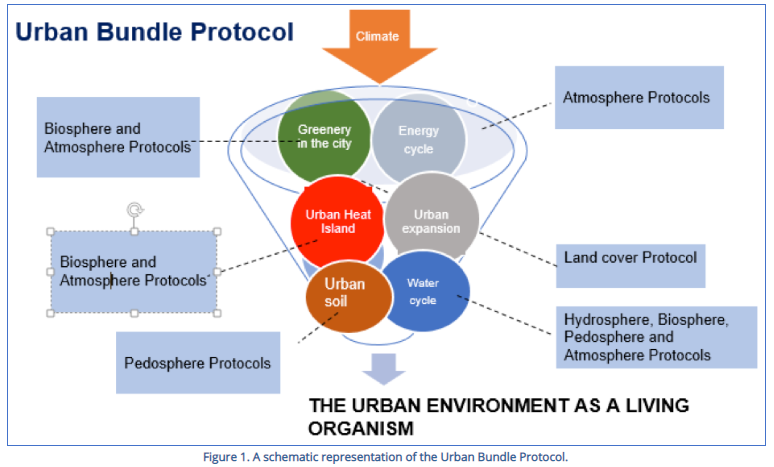
Urban Bundle
The purpose of the Urban Bundle is to suggest a group of GLOBE protocols that can provide students and teachers with integrated knowledge of the environment in urban areas, including various processes and their interactions. Given the many small-scale variations caused by the built environment, such citizen science contributions are particularly needed to adequately characterize the urban environment. (Source: GLOBE Urban Protocol Bundle)
The GLOBE database provides data submitted by individuals for specific protocols which can be used in investigations. In addition, there are additional data available in the My NASA Data Earth System Data Explorer. These data can provide context and background information or provide data for additional locations. There are also data for additional parameters not included in GLOBE.
When investigating urban areas, there are many interrelated variables that can be explored through the Earth System Data Explorer. Some of these are directly related to a GLOBE protocol which is part of the Urban protocol bundle. Others are indirectly related. The data sets below have been identified as those that can complement these investigations. The specific GLOBE protocols used in the bundle can be found in the section below the related Earth System Data Explorer datasets section.
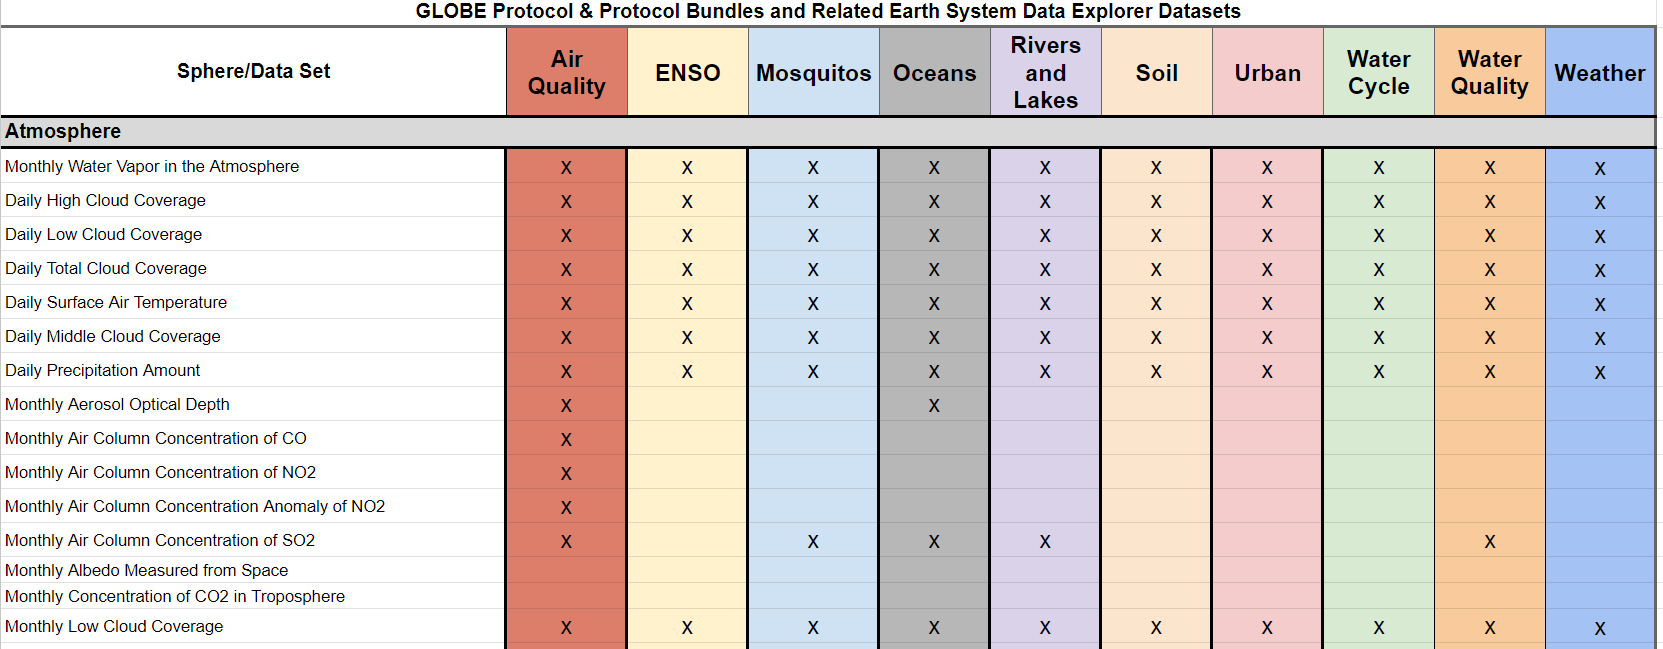
Related Earth System Data Explorer data sets:
Explore the MND GLOBE Connections Datasets spreadsheet to review the range of datasets available to integrate with GLOBE Protocol Bundle research by visiting the link.
Dataset Recommendations and Rationale:
Air and surface temperature data sets allow students to explore daily and monthly average temperatures and anomalies. Temperatures can vary between urban and rural areas. These can also highlight interactions between air and water temperatures. Surface temperatures are also related to the urban heat island effect.
- Daily Surface Air Temperature
- Monthly Surface Air Temperature
- Monthly Surface Air Temperature Anomaly
- Monthly Daytime Surface (Skin) Temperature
- Monthly Nighttime Surface (Skin) Temperature
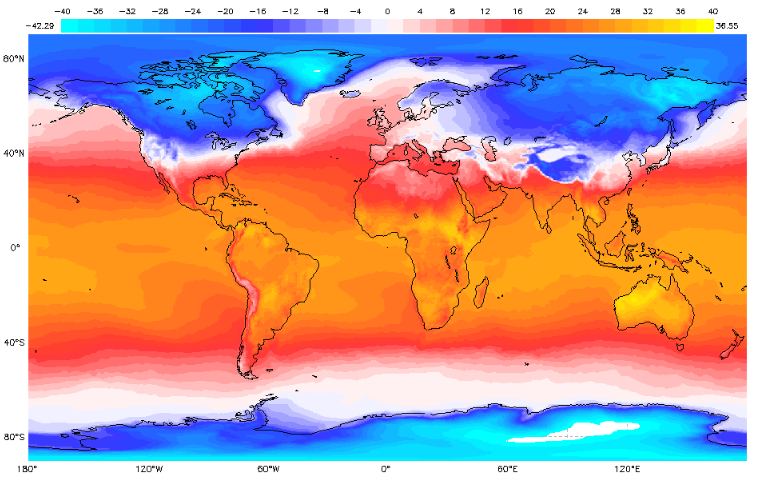
Monthly Surface Air Temperature - February 2019
Cloud data provide information about weather, relative humidity and precipitation. There are data about cloud opacity (how much sunlight clouds absorb) and phase (clouds contain liquid, ice, or mixture of both types). There are also data sets which students can use to compare the net flow of energy towards Earth with and without clouds to see the impact of clouds on the energy budget. Finally, there are precipitation data which can be compared with cloud cover.
- Daily High Cloud Coverage
- Daily Low Cloud Coverage
- Daily Mean Relative Humidity
- Daily Middle Cloud Coverage
- Daily Total Cloud Coverage
- Monthly Low Cloud Coverage
- Monthly Total Cloud Coverage
- Monthly Water Vapor in the Atmosphere
- Daily Precipitation Amount
- Monthly Average Precipitation Rate
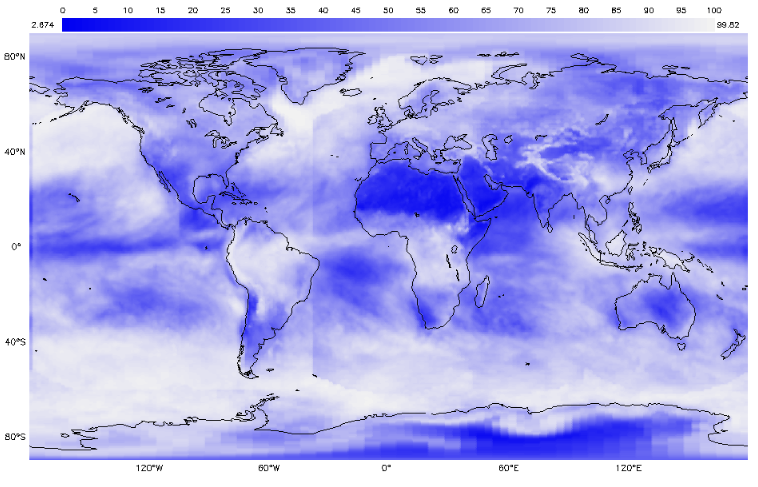
Monthly Total Cloud Cover - January 2019
Biometry information can be related to chlorophyll, leaf area index and normalized difference vegetation. These provide indications of vegetation growth patterns in different environments over time and can be indications of plant health.
- Monthly Chlorophyll Concentration
- Monthly Leaf Area Index
- Monthly Normalized Difference Vegetation Index
GLOBE Protocols Included
- Atmosphere
- Air Temperature - Measure the current air temperature when an instrument shelter is not available. Current air temperature is measured using a thermometer held in the open air but in the shade for at least 3 minutes.
- Clouds - Observe and report which types of clouds are visible, how much of the sky is covered by clouds, and the opacity of clouds. Also report sky and surface conditions.
- Precipitation (including pH) - To determine the amount of moisture input to the local environment by measuring rain and snowfall and to measure the pH of precipitation.
- Relative Humidity - Students measure the relative humidity using either a digital hygrometer or a sling psychrometer.
- Surface Temperature - Students use an infrared thermometer (IRT) to measure the temperature of Earth's surface.
- Biosphere
- Biometry - Students measure properties of vegetation and identify species in order to classify land cover using the MUC System and to provide supplemental information about their site.
- Land Cover Classification - Students locate, photograph, and determine the MUC class for 90 m x 90 m areas of homogeneous land cover.
- Hydrosphere
- Water Temperature - Students will measure the temperature of water.
- Pedosphere (Geosphere)
- Soil Characterization - Students will identify horizons in a soil profile, observe the structure, color, consistence, texture, and the presence of rocks, roots, and carbonates of each horizon, and take samples for use in laboratory characterization protocols.
- Soil Infiltration - Students will use a dual ring infiltrometer that they can construct from large food container cans to measure the rate at which water soaks into the soil during a roughly 45-minute period.
- Soil Moisture - There are several GLOBE protocols for soil moisture. This gives students more than one way to determine soil moisture.
- Gravimetric: Students will measure soil water content by comparing the wet and dry masses of samples.
- Soil Temperature - Students will measure near-surface soil temperature frequently near local solar noon and seasonally throughout two diurnal cycles.