
Grade Level: 3-5,
6-8,
9-12
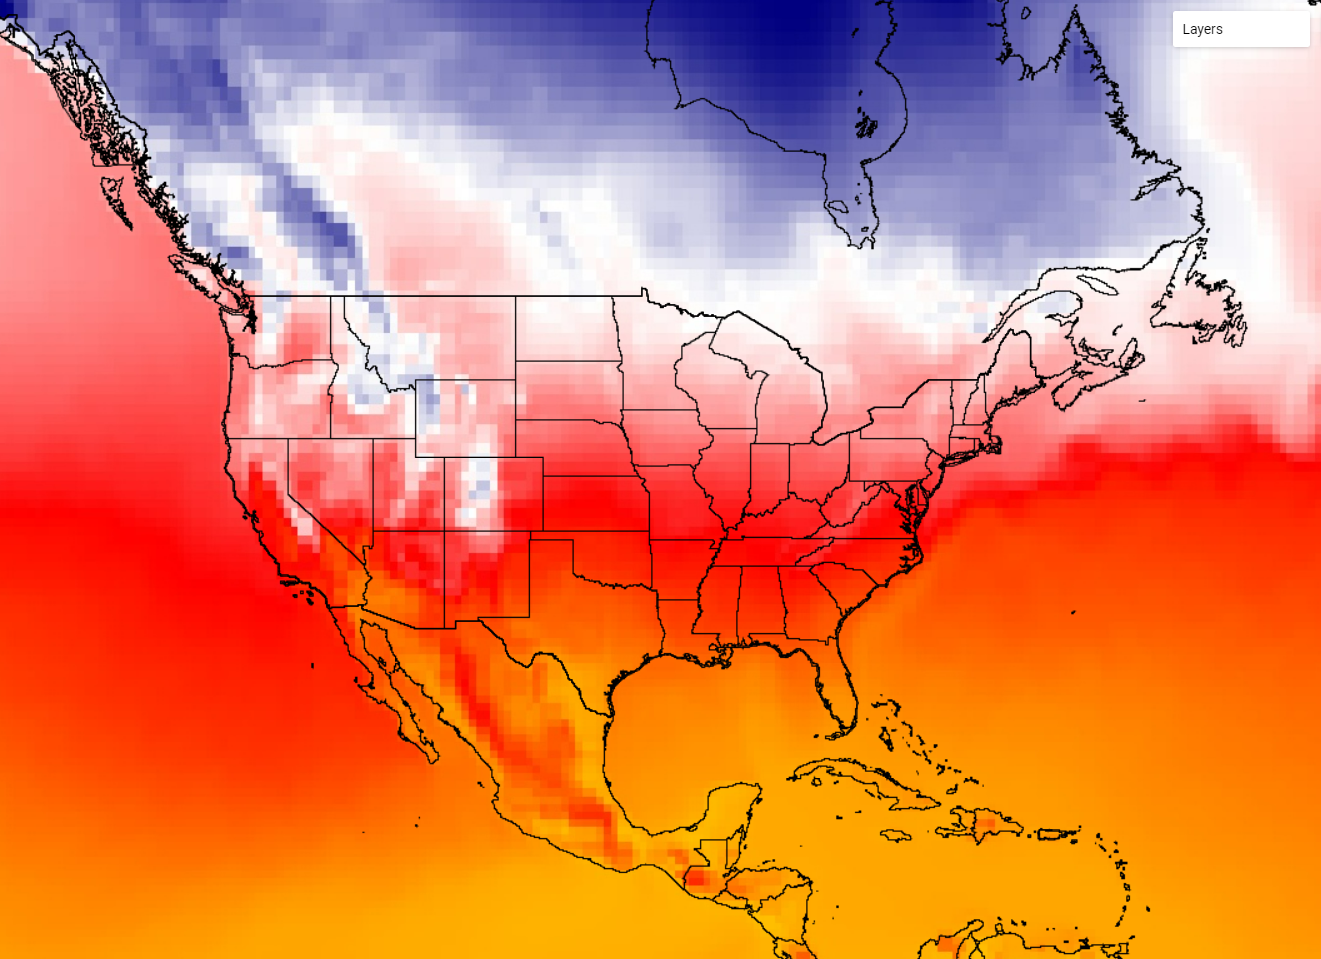
The Earth System Satellite Images, along with the Data Literacy Cubes, helps the learner identify patterns in a specific image.
Select a Sphere:


The Earth System Satellite Images, along with the Data Literacy Cubes, helps the learner identify patterns in a specific image.
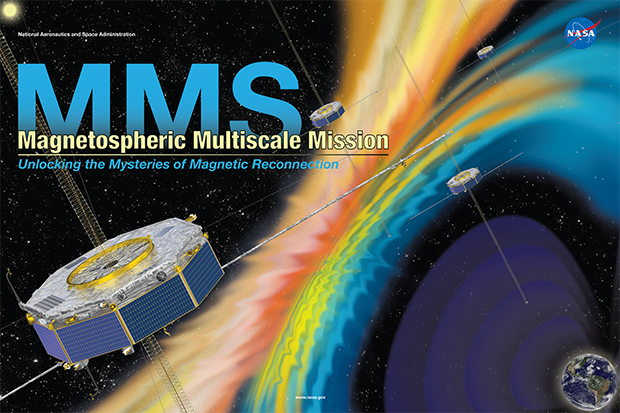
Learners will build a 2D model of the Magnetospheric Multiscale (MMS) Spacecraft model.
Learners will analyze space-weather data from the National Oceanic and Atmospheric Administration (NOAA). Learners will compare two different types of data: sunspot data and measurements from magnetometers on Earth.
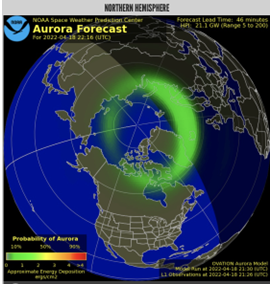
In this activity, learners predict the likelihood of aurora on Earth by examining the Kp-index and using NOAA’s 30-minute aurora forecast.
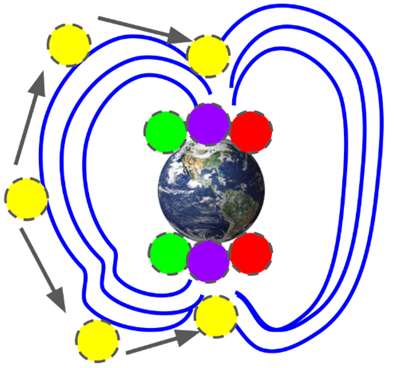
Using a “fun-size” bag of rainbow bite-sized candies learners will place different colored candies on a diagram of the Sun-Earth system to show different space weather conditions during solar minimum and solar maximum.
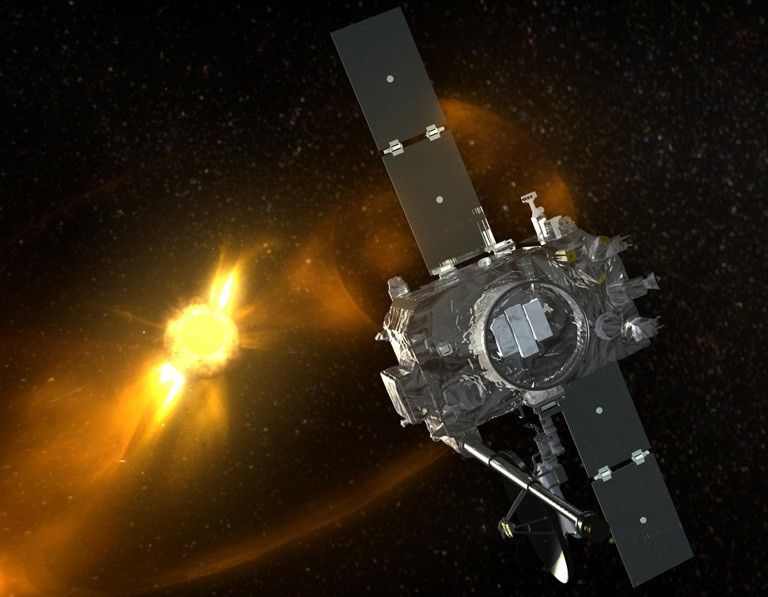
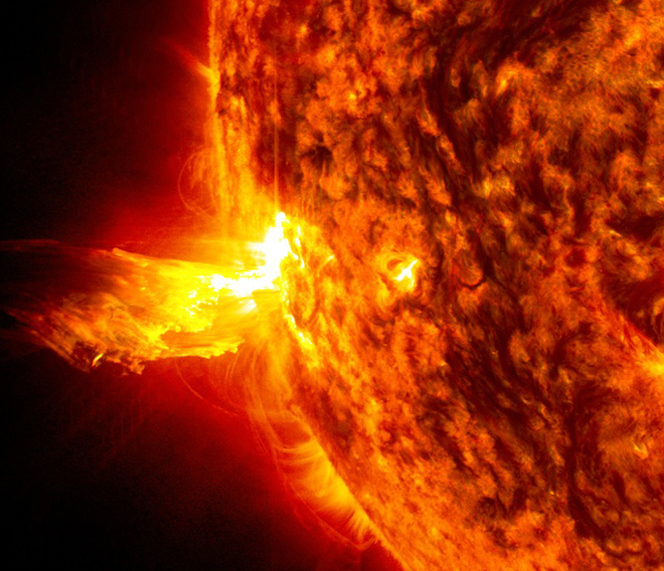
In this activity, learners will explore an additional tool used to observe the Sun’s atmosphere, called a coronagraph. Learners will create a flipbook of a coronagraph showing a coronal mass ejection.

Learners use a compass to trace magnetic field lines of a bar magnet. They observe a CME hitting Earth’s magnetosphere and compare its shape to the magnet. They then apply their understanding of magnetic fields to those found on the Sun.
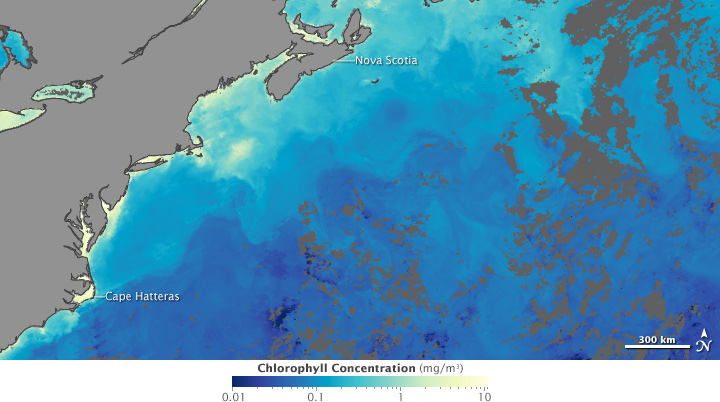
Students analyze and compare satellite data of Ocean Chlorophyll Concentrations with Sea Surface Temperatures, beginning with the North Atlantic region, while answering questions about the global patterns of these phenomenon.
In this lesson students will explore the Solar Orbiter Mission.
Download NASA satellite data to create a custom climograph for a specific location.
These NASA lessons support Next Generation Science Standards (NGSS) and three dimensional learning of the Earth System. These include activities where students interact with NASA maps, graphs, and datasets from the atmosphere, biosphere, cryosphere, geosphere, hydrosphere and the earth system.

