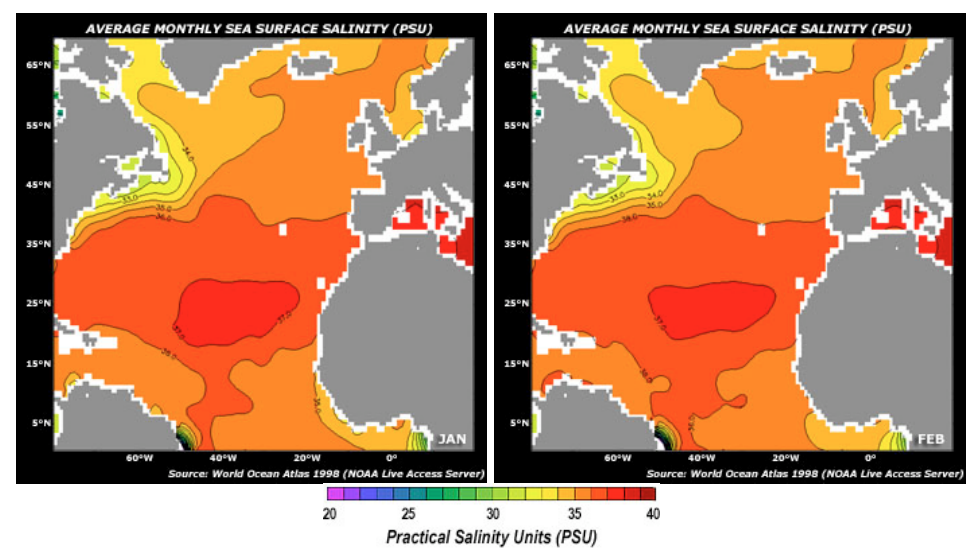
Students will observe monthly satellite data of the North Atlantic to identify relationships among key science variables that include sea surface salinity (SS), air temperature at the ocean surface (AT), sea surface temperature (ST), evaporation (EV), precipitation (PT), and evaporation minus pre
List of all Earth as a System Lesson Plans
Students analyze historic plant growth data (i.e., Peak Bloom dates) of Washington, D.C.’s famous cherry blossom trees, as well as atmospheric near surface temperatures as evidence for explaining the phenomena of earlier Peak Blooms in our nation’s capital.
In this lesson, Observing Earth’s Seasonal Changes, students observe patterns of average snow and ice amounts as they change from one month to another, as well as connect the concepts of the tilt and orbit of the Earth (causing the changing of seasons) with monthly snow/ice data from January 2008
The Earth System Poster activity walks learners through global patterns and illuminates how each of the spheres is interconnected across the world. We will divide into small groups to look at maps of different parts of the earth system that have been observed by NASA satellites.
NASA visualizers take data – numbers, codes – and turn them into animations people can see and quickly understand.
Students will examine a 2014-2015 El Niño Southern Oscillation (ENSO) event to identify relationships among sea surface height, sea surface temperature, precipitation, and wind vectors.
Students are introduced to the Earthrise phenomenon by seeing the Earth as the Apollo 8 astronauts viewed our home planet for the first time from the Moon. They will analyze a time series of mapped plots of Earth science variables that NASA monitors to better understand the Earth
This investigation is part of the NASA: Mission Geography Module "What are the causes and consequences of climate change?" that guides students through explorations in climatic variability and evidence for global climate change.
Hands-on demonstration of the El Niño Effect, trade winds, and upwelling provided by NASA's Jet Propulsion Lab.
This USGS activity leads students to an understanding of what remote sensing means and how researchers use it to study changes to the Earth’s surface, such as deforestation.