


Grade Level: 6-8,
9-12
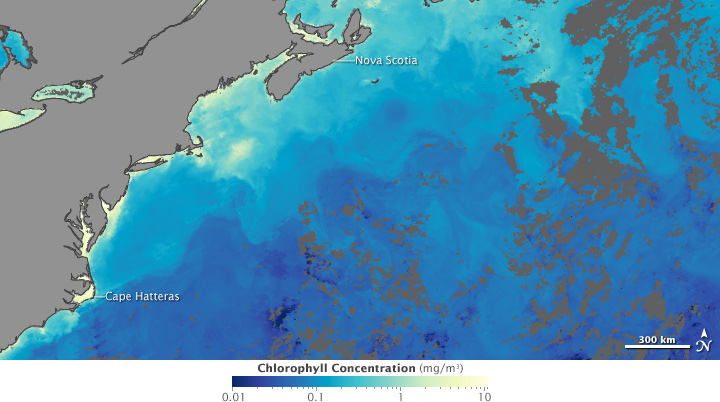
Students analyze and compare satellite data of Ocean Chlorophyll Concentrations with Sea Surface Temperatures, beginning with the North Atlantic region, while answering questions about the global patterns of these phenomenon.