Grade Level: 3-5,
6-8
This activity was developed by NASA's Global Precipitation Measurement (GPM) team as an introductory experience to a series of lessons about water resources on Earth.
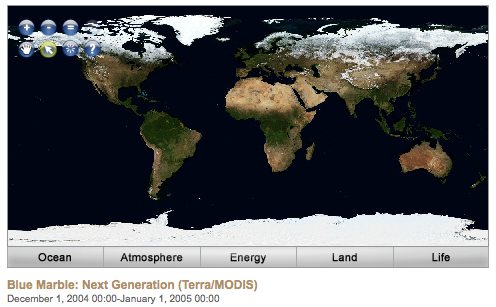
Select a Sphere:


This activity was developed by NASA's Global Precipitation Measurement (GPM) team as an introductory experience to a series of lessons about water resources on Earth.
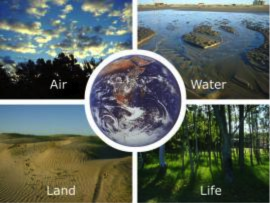
Air, Water, Land, & Life: A Global Perspective
Students will analyze and interpret maps of the average net atmospheric radiation to compare the flow of energy from the Sun toward Earth in different months and for cloudy versus clear days. Students will draw conclusions and support them with evidence.
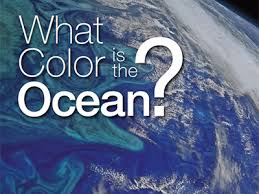
In this activity, you will use an inexpensive spectrophotometer* to test how light at different visible wavelengths (blue, green, red) is transmitted, or absorbed, through four different colored water samples.
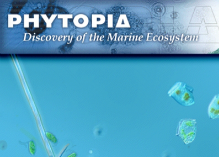
This lesson is taken from NASA's Phytopia: Discovery of the Marine Ecosystem written in partnership with Bigelow Laboratory for Ocean Science with funding from the National Science Foundation.

In this lesson, students investigate and identify various phytoplankton using images that were previously taken with a compound microscope. Credit: This lesson is modified from a lesson of the same name created by The Center for Microbial Oceanography: Research and Education 

Students use Phytopia: Exploration of the Marine Ecosystem, a computer-based tool, to investigate various phytoplankton species and topics relating to phytoplankton biology.
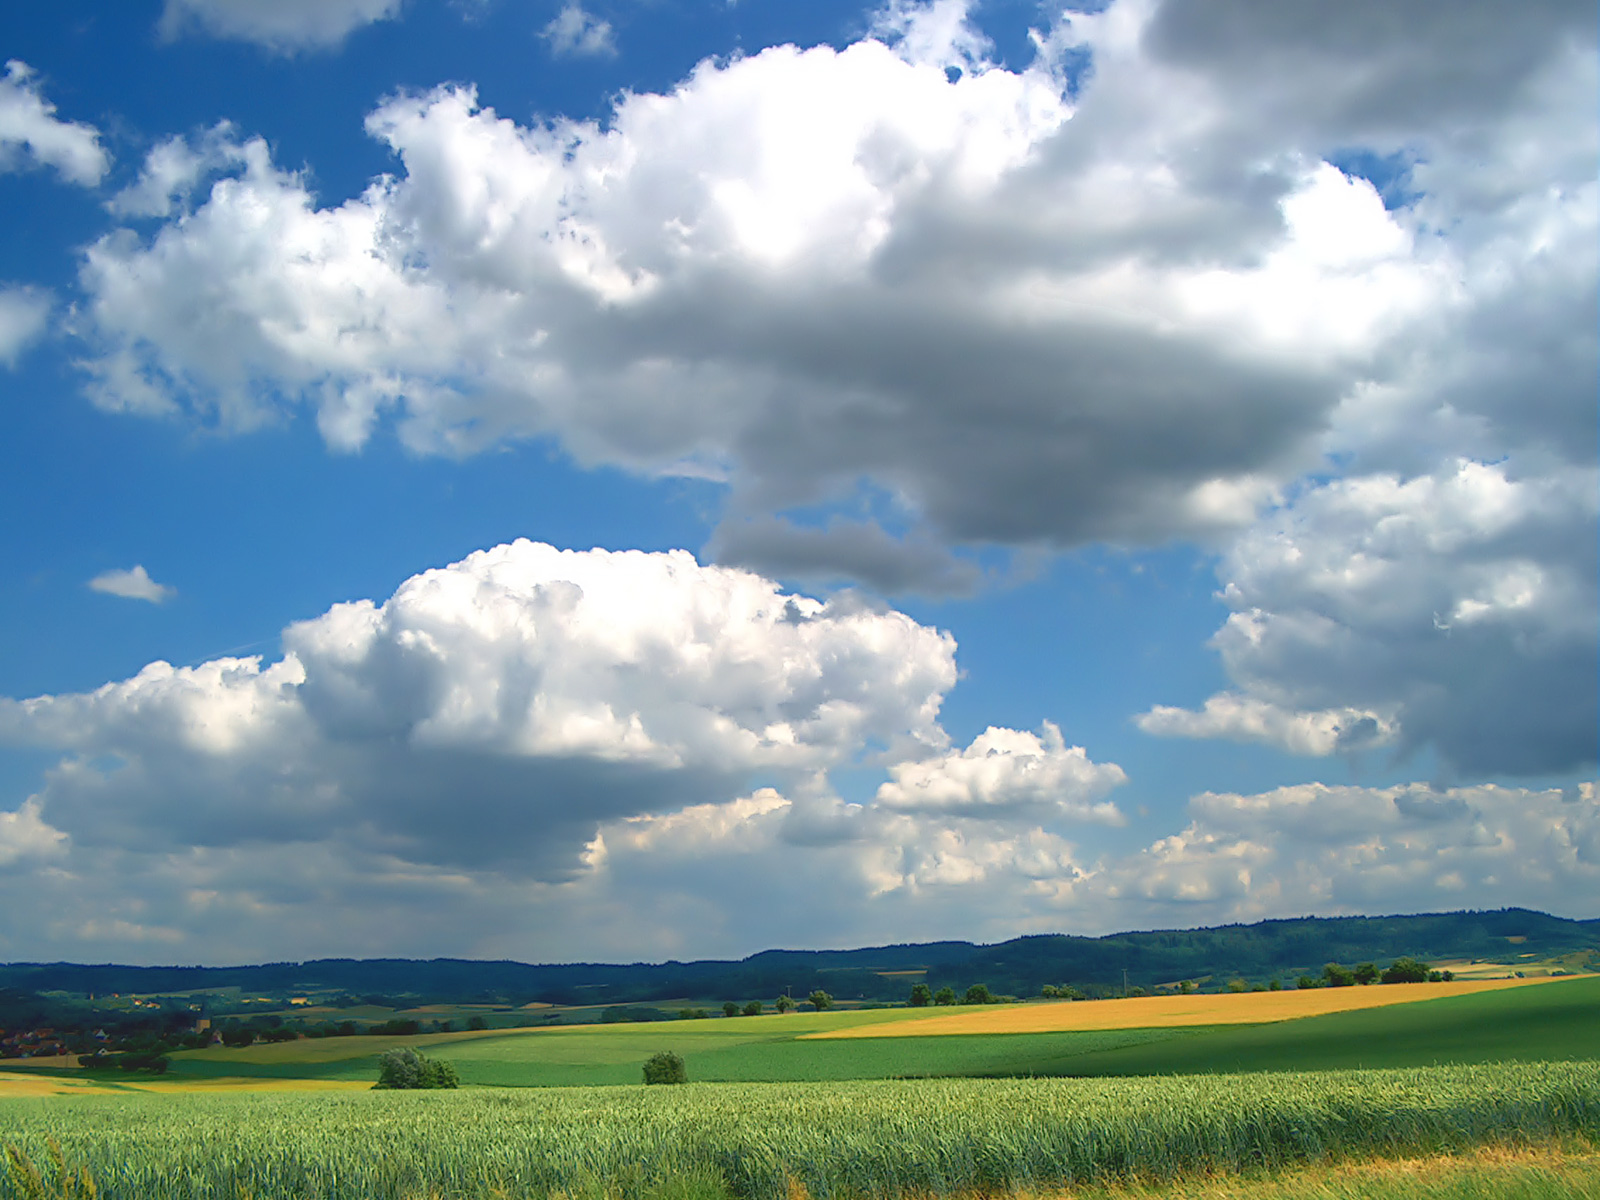
To investigate the different rates of heating and cooling of certain materials on earth in order to understand the heating dynamics that take place in the Earth’s atmosphere.
Students collect and analyze temperature data to explore what governs how much energy is reflected.
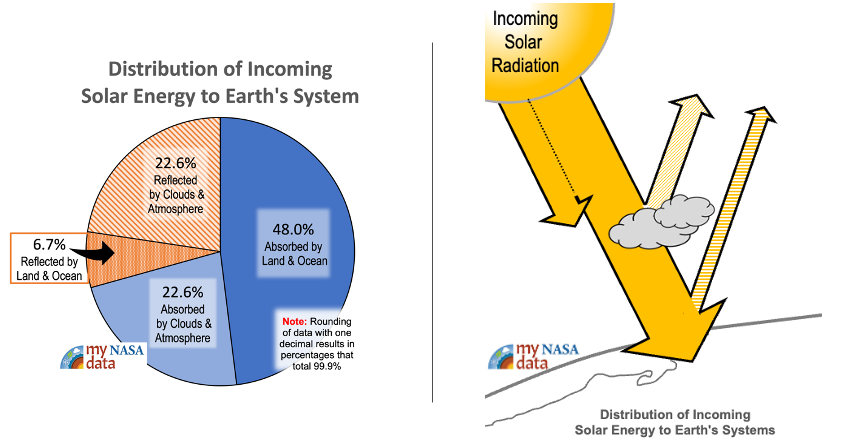
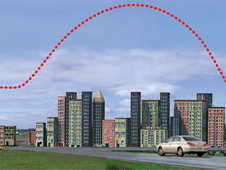
A kinesthetic activity that challenges students to participate in a model that describes the fate of solar energy as it enters the Earth system. A good initial lesson for Earth’s energy budget, students unravel the benefits and limitations of their model.
These NASA lessons support Next Generation Science Standards (NGSS) and three dimensional learning of the Earth System. These include activities where students interact with NASA maps, graphs, and datasets from the atmosphere, biosphere, cryosphere, geosphere, hydrosphere and the earth system.


