

Grade Level: 3-5,
6-8,
9-12
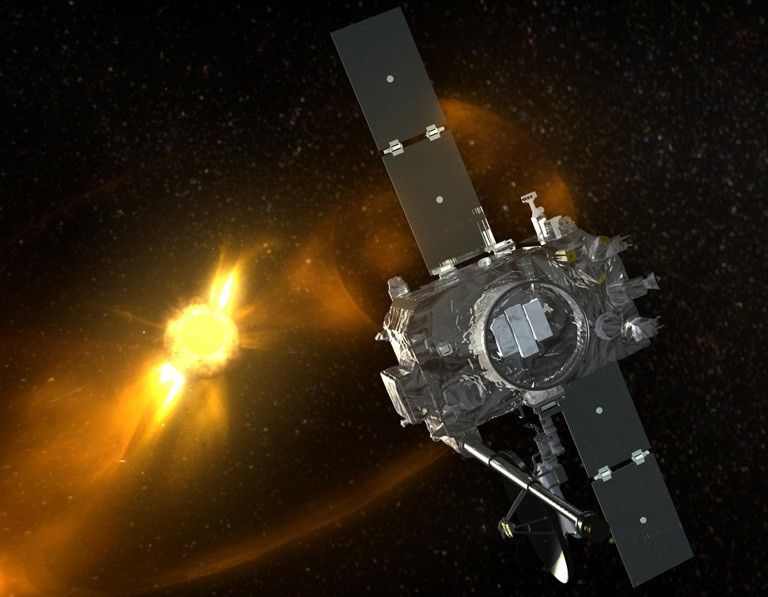
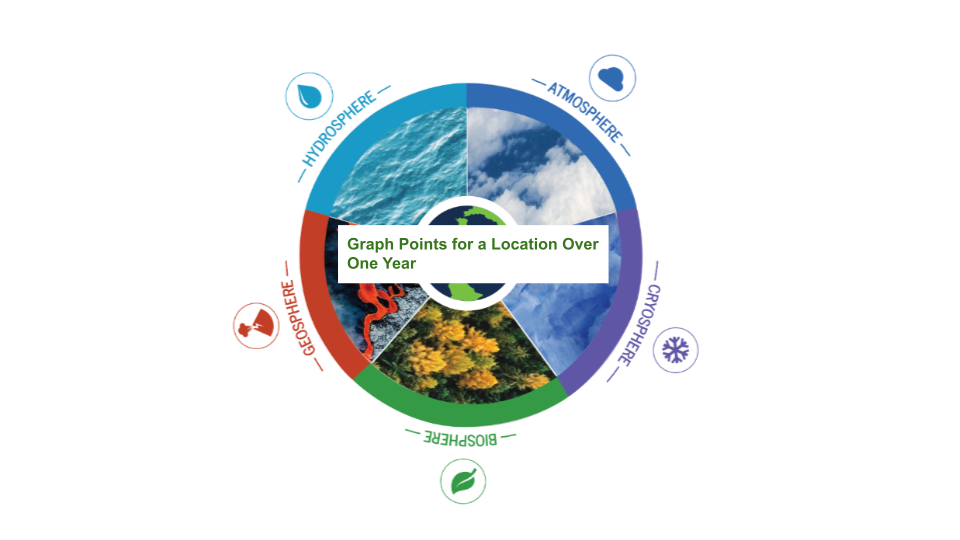
The Earth System Satellite, help the learner visualize how different Earth system variables change over time. In this lesson, students will graph six points for a location over one year.