


Grade Level: 3-5,
6-8,
9-12
NASA visualizers take data – numbers, codes – and turn them into animations people can see and quickly understand.
Select a Sphere:


NASA visualizers take data – numbers, codes – and turn them into animations people can see and quickly understand.
Students will examine a 2014-2015 El Niño Southern Oscillation (ENSO) event to identify relationships among sea surface height, sea surface temperature, precipitation, and wind vectors.

Students are introduced to the Earthrise phenomenon by seeing the Earth as the Apollo 8 astronauts viewed our home planet for the first time from the Moon. They will analyze a time series of mapped plots of Earth science variables that NASA monitors to better understand the Earth
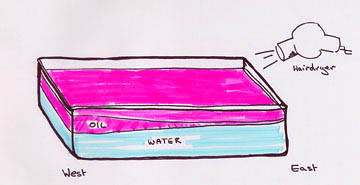
Hands-on demonstration of the El Niño Effect, trade winds, and upwelling provided by NASA's Jet Propulsion Lab.
This USGS activity leads students to an understanding of what remote sensing means and how researchers use it to study changes to the Earth’s surface, such as deforestation.
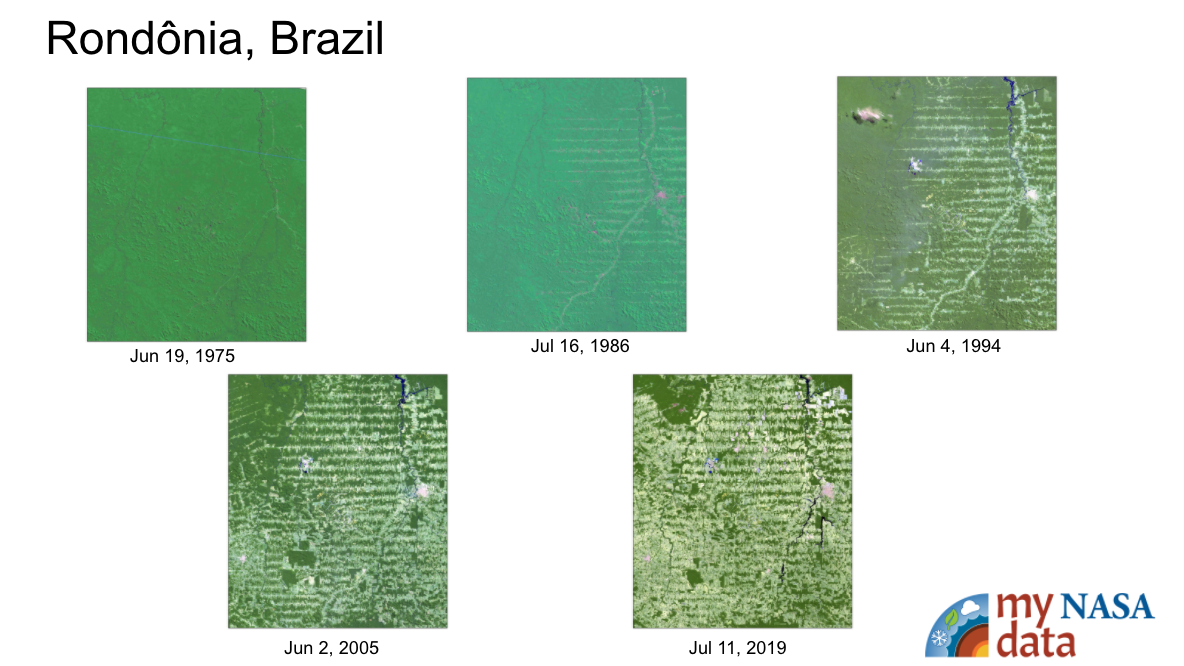
The purpose of this activity is to have students use an Earth Systems perspective to identify the various causes associated with changes to Earth's forests as they review Landsat imagery of site locations from around the world.
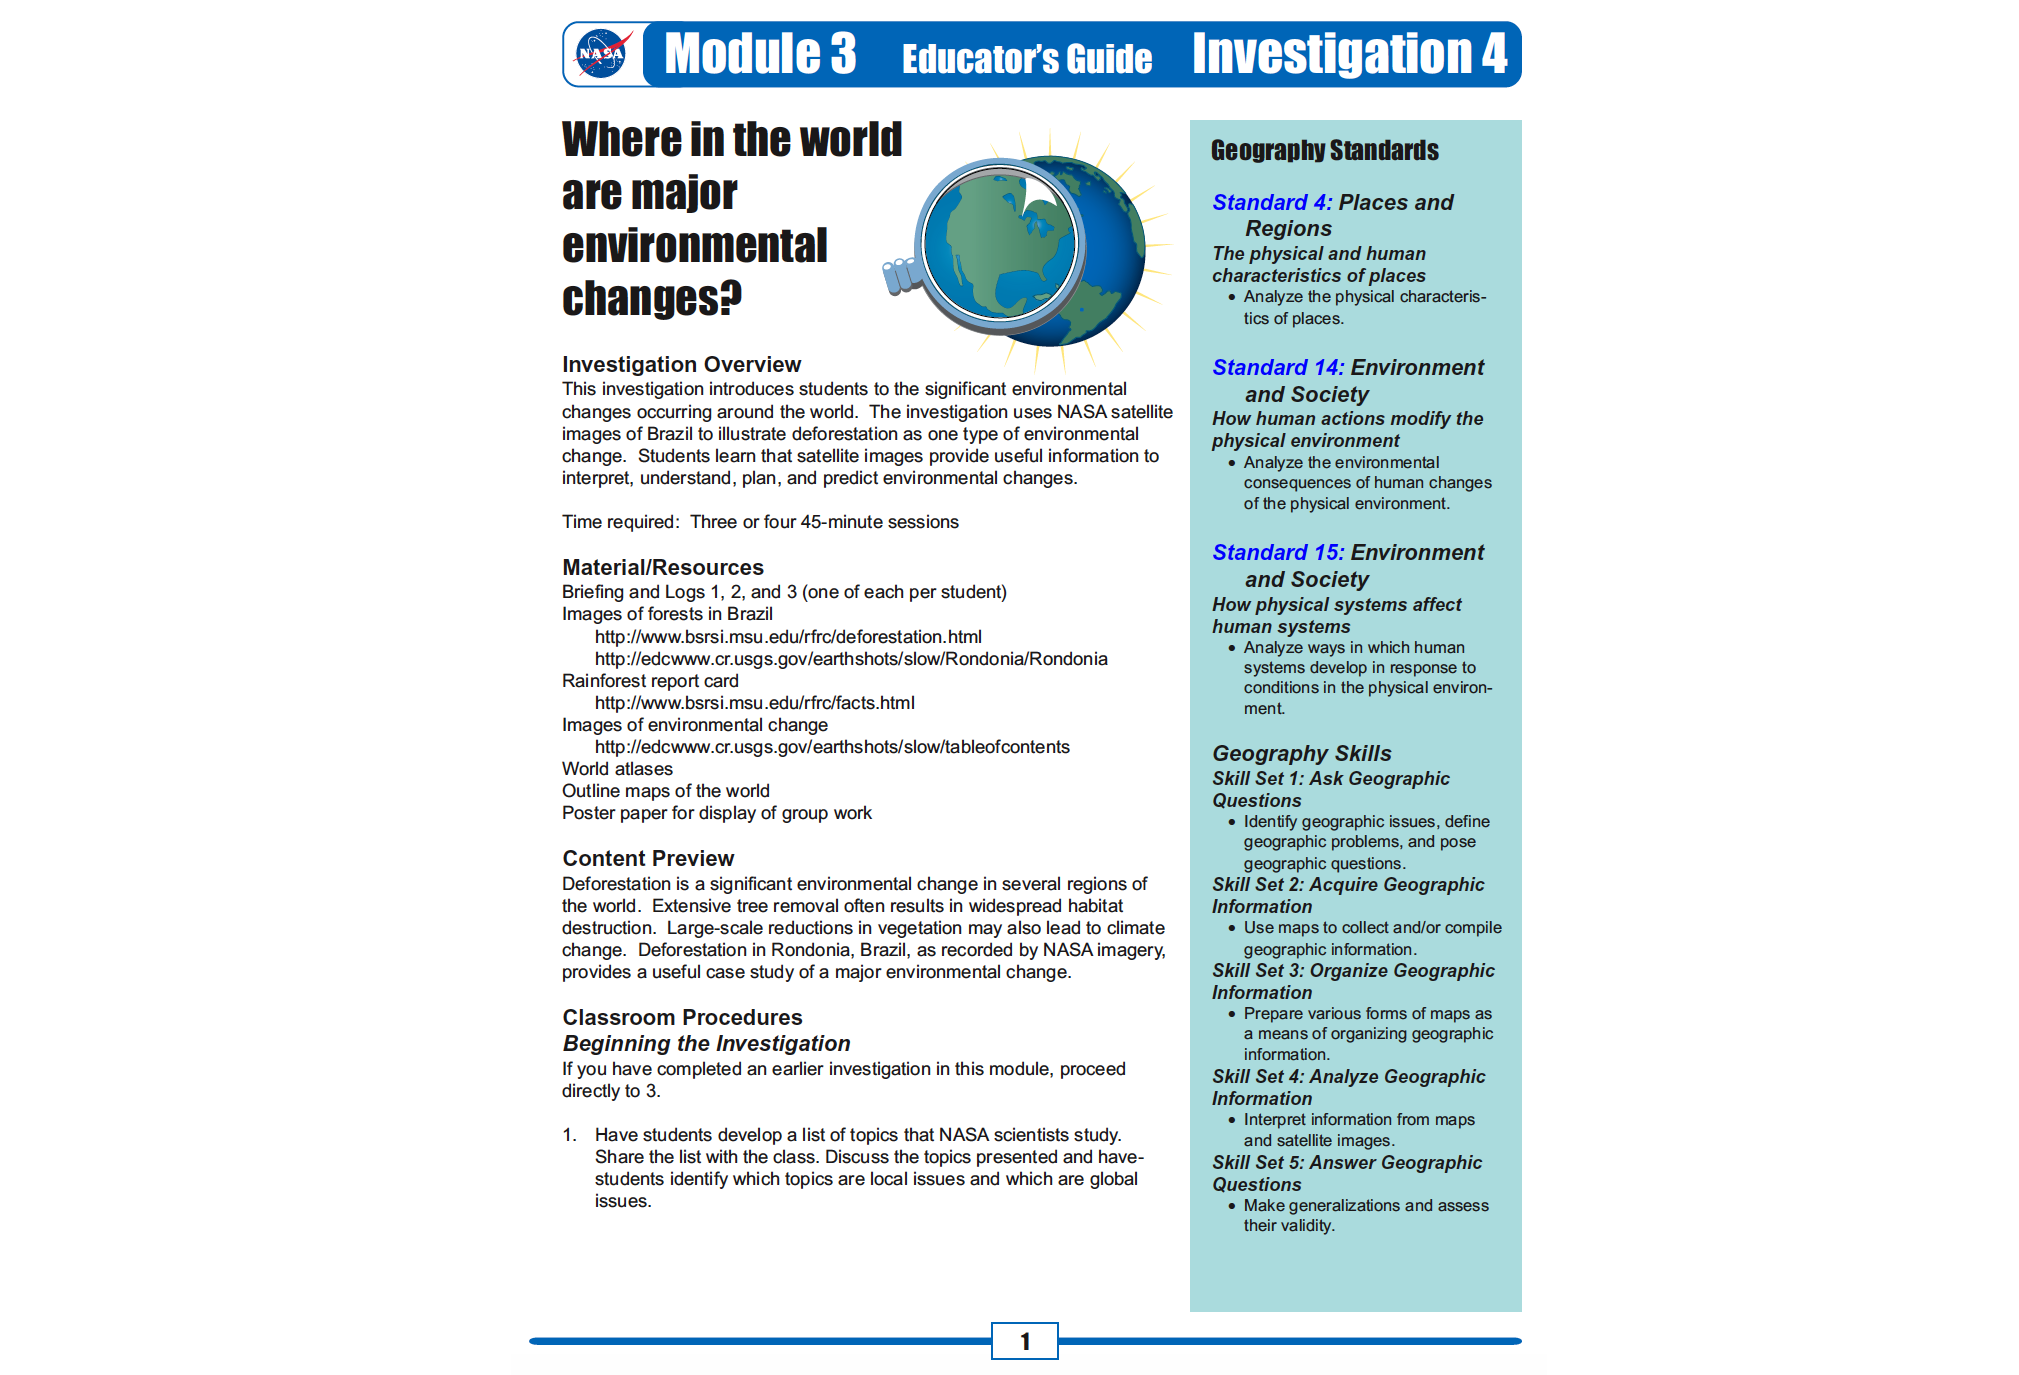
This investigation introduces students to the significant environmental changes occurring around the world. The investigation uses NASA satellite images of Brazil to illustrate deforestation as one type of environmental change.

In this lesson, students will investigate the drivers of climate change, including adding carbon dioxide and other greenhouse gases to the atmosphere, sea level rise, and the effect of decreasing sea ice on temperatures.
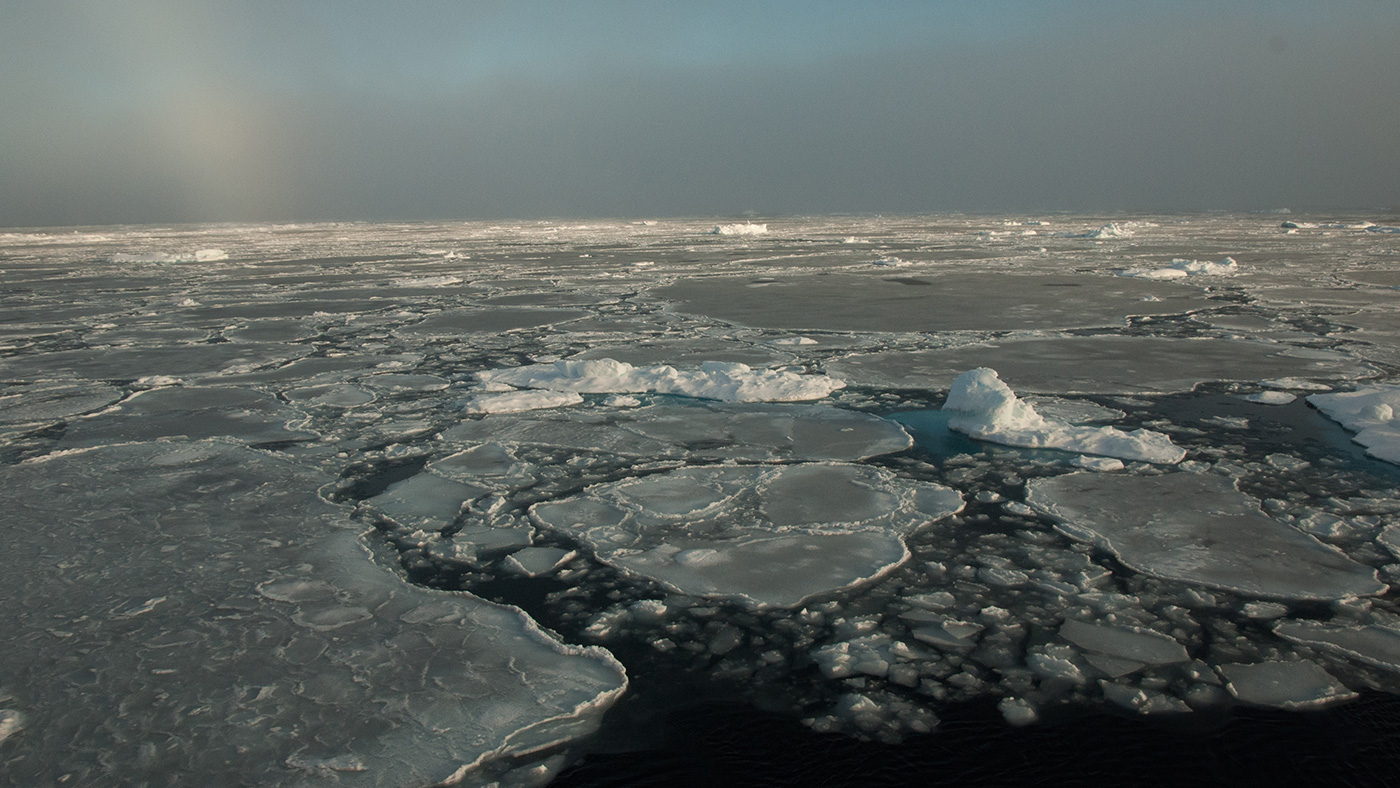
This activity invites students to simulate and observe the different effects on sea level from melting sea-ice.
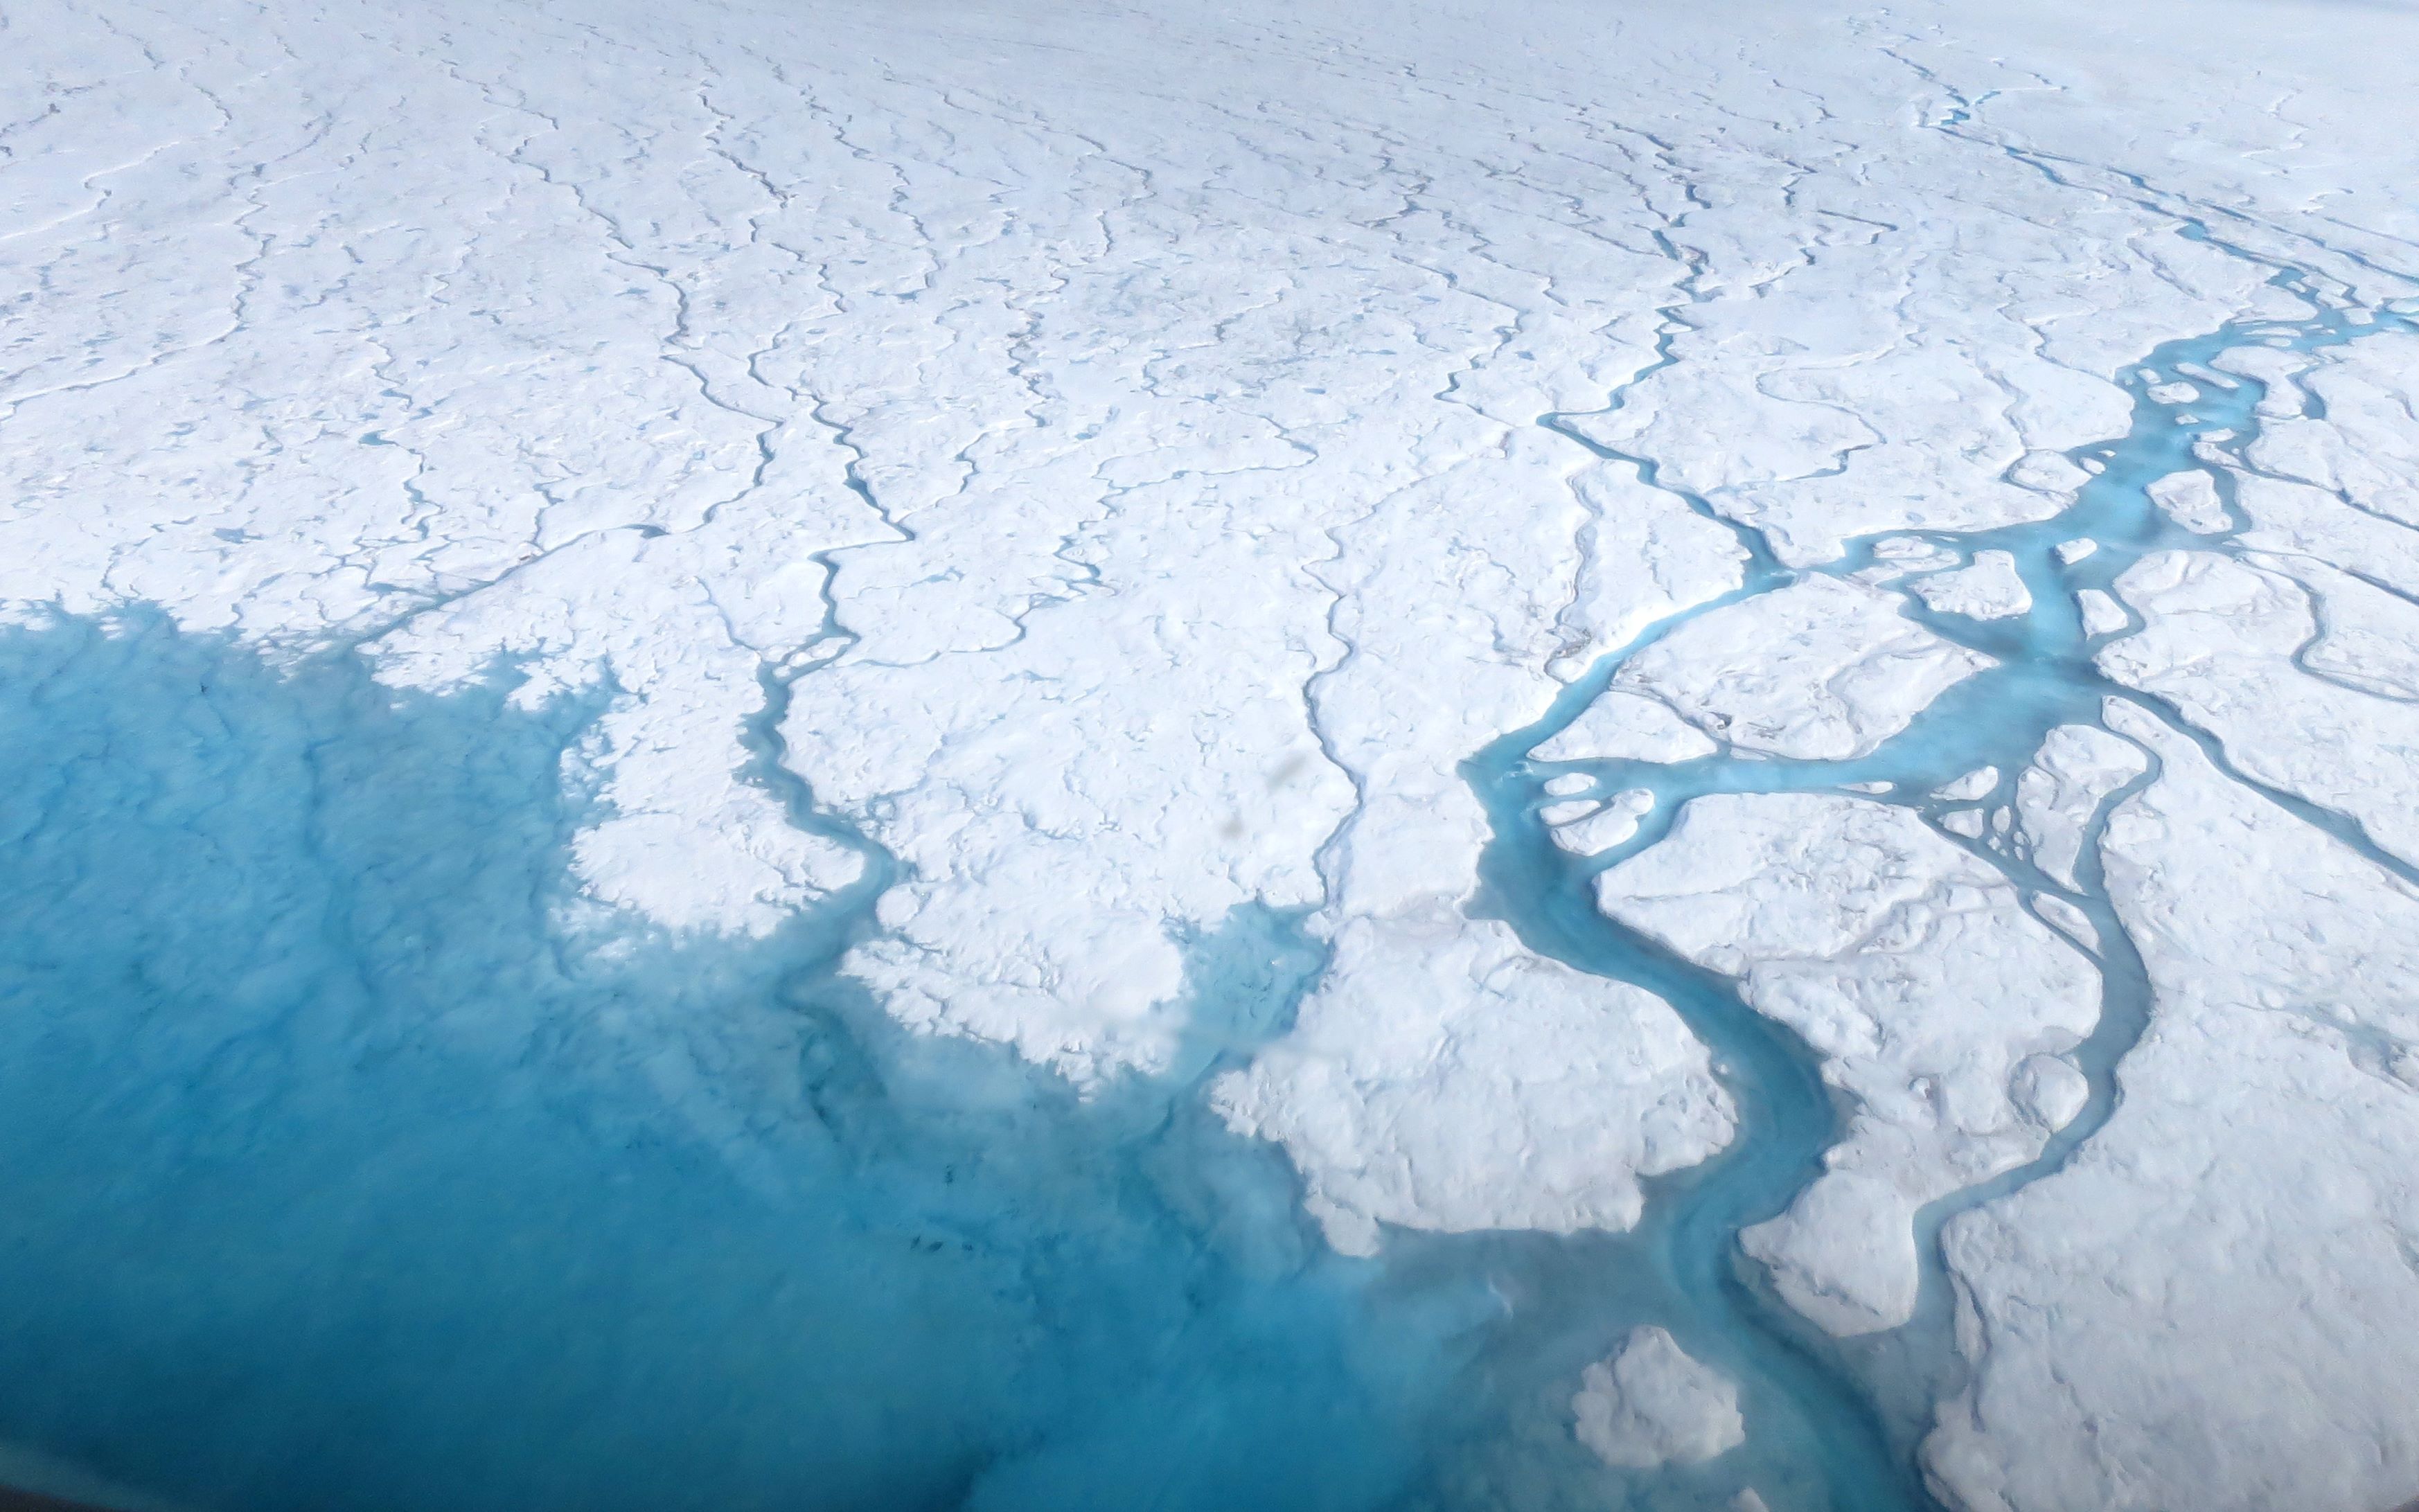
This activity invites students to model and observe the effect of melting ice sheets (from land) on sea level and the difference between the effect of melting sea-ice to that of melting land ice on sea level.
These NASA lessons support Next Generation Science Standards (NGSS) and three dimensional learning of the Earth System. These include activities where students interact with NASA maps, graphs, and datasets from the atmosphere, biosphere, cryosphere, geosphere, hydrosphere and the earth system.