Grade Level: 6-8
To help students articulate and integrate their existing knowledge about the air, water, soil, and living things by viewing them as interacting parts of a system
Select a Sphere:


To help students articulate and integrate their existing knowledge about the air, water, soil, and living things by viewing them as interacting parts of a system
Students discuss their current understanding of what Earth systems are and how they work and consider how to identify the boundaries of a region for Earth system study.
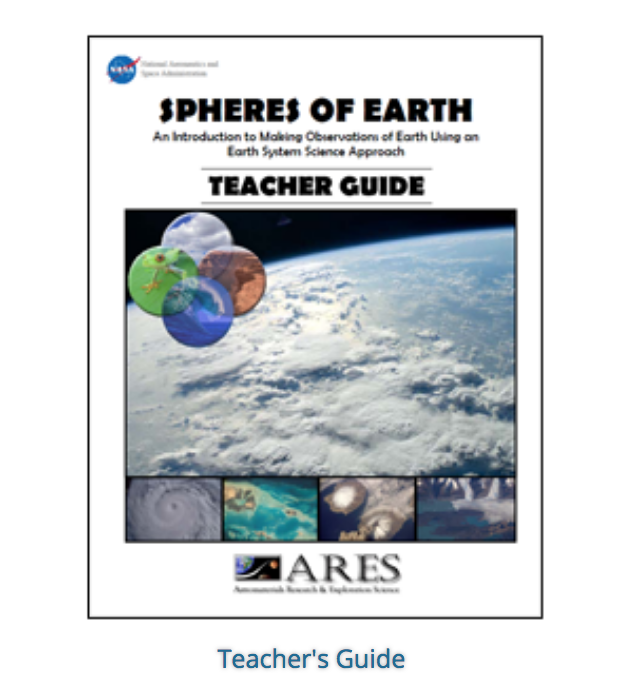
This activity introduces students to aspects of the atmosphere, biosphere, hydrosphere, and litho/geosphere and how they are interrelated. It is designed to promote an interest in authentic investigations of Earth using images acquired by astronauts as the hook.

The activities in this guide will help students understand variations in environmental parameters by examining connections among different phenomena measured on local, regional and global scales.
Students will practice the process of making claims, collecting evidence to support claims, and applying scientific reasoning to connect evidence to claims.
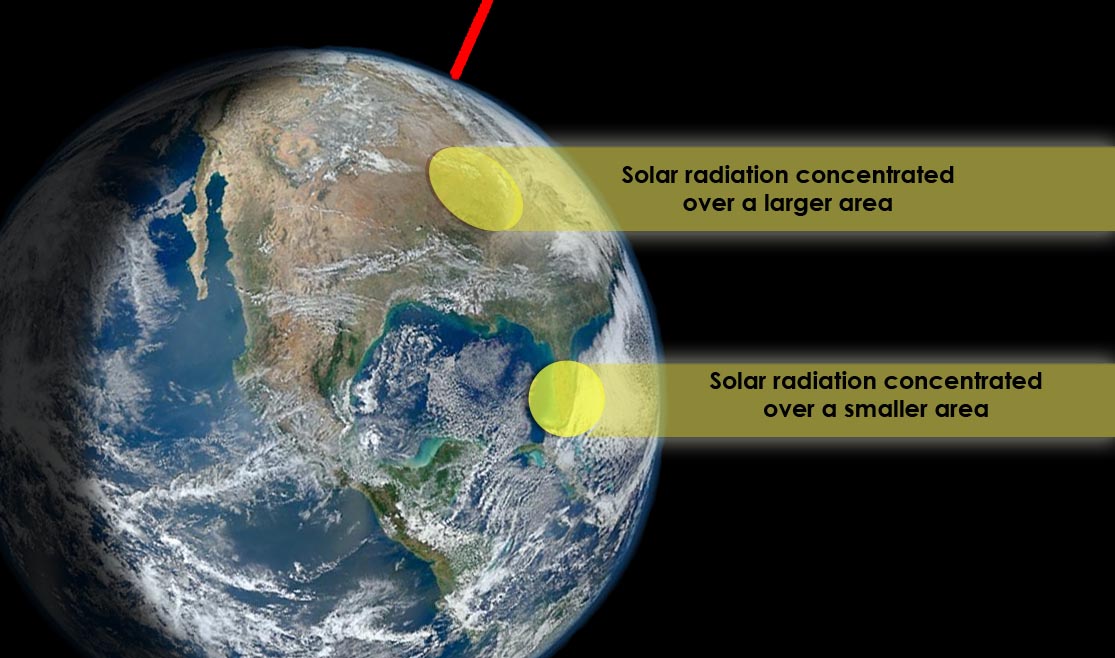
Students will analyze surface temperature and solar radiation data to construct explanations about the relationship of seasons and temperature to the amount of solar energy received on Earth’s surface.

Examine (daytime) surface temperature and solar radiation received at locations found near similar latitudes using NASA Data.
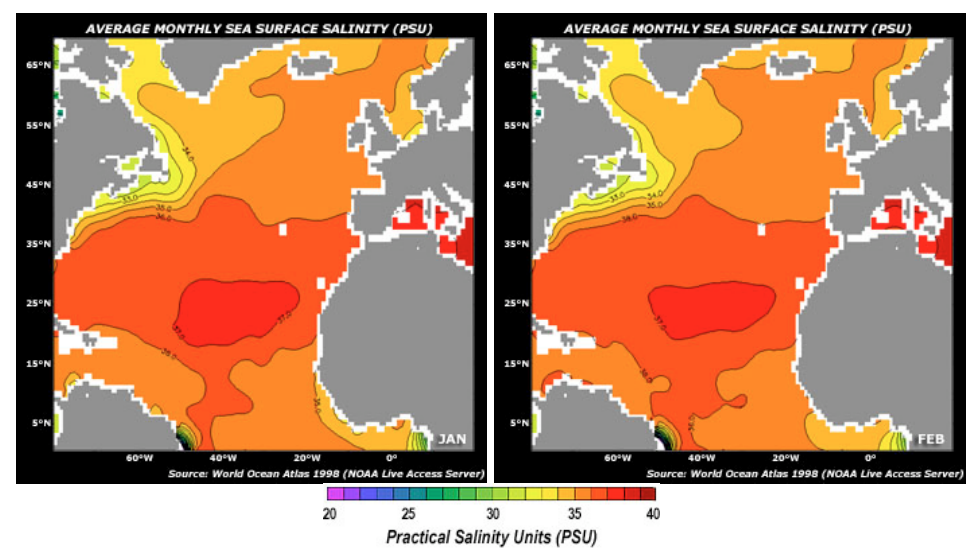
Students will observe monthly satellite data of the North Atlantic to identify relationships among key science variables that include sea surface salinity (SS), air temperature at the ocean surface (AT), sea surface temperature (ST), evaporation (EV), precipitation (PT), and evaporation minus pre
Students analyze historic plant growth data (i.e., Peak Bloom dates) of Washington, D.C.’s famous cherry blossom trees, as well as atmospheric near surface temperatures as evidence for explaining the phenomena of earlier Peak Blooms in our nation’s capital.
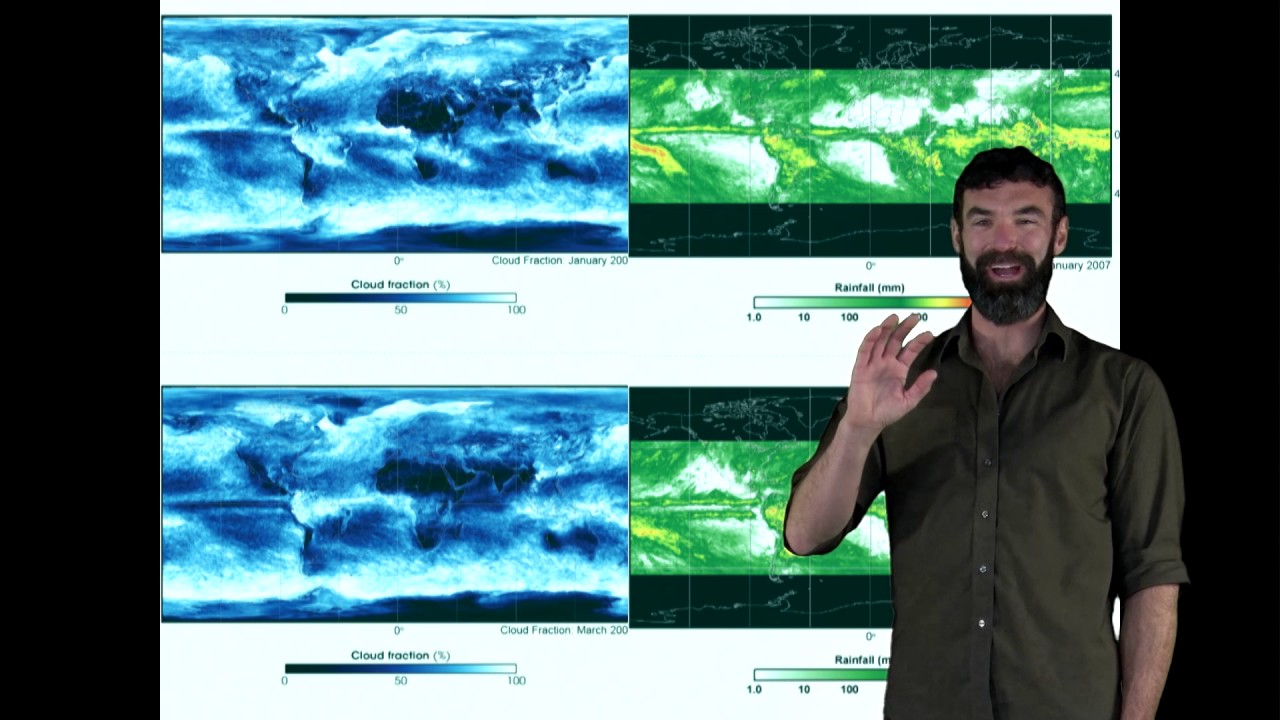
The Earth System Poster activity walks learners through global patterns and illuminates how each of the spheres is interconnected across the world. We will divide into small groups to look at maps of different parts of the earth system that have been observed by NASA satellites.
These NASA lessons support Next Generation Science Standards (NGSS) and three dimensional learning of the Earth System. These include activities where students interact with NASA maps, graphs, and datasets from the atmosphere, biosphere, cryosphere, geosphere, hydrosphere and the earth system.


