

Grade Level: 3-5,
6-8,
9-12
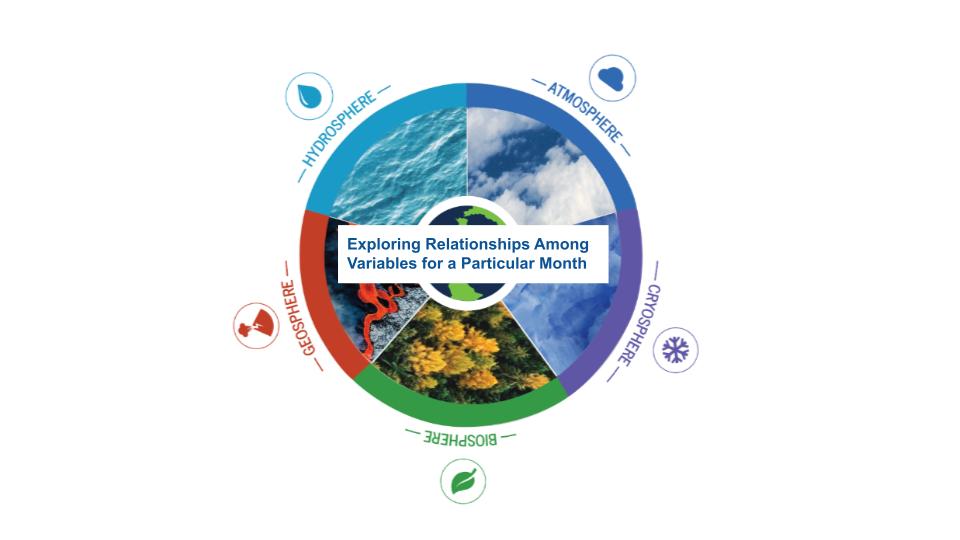
The Earth System Satellite Images, along with the Data Literacy Cubes, help the learner determine relationships among variables.
Select a Sphere:


The Earth System Satellite Images, along with the Data Literacy Cubes, help the learner determine relationships among variables.
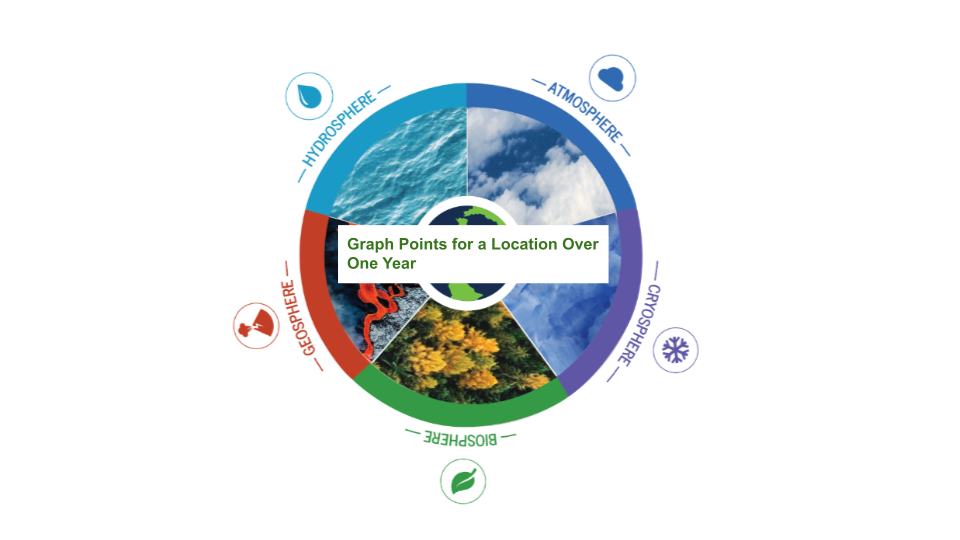
The Earth System Satellite, help the learner visualize how different Earth system variables change over time. In this lesson, students will graph six points for a location over one year.
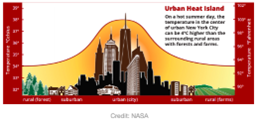
The Urban Heat Island Implementation Sequence provides a series of lessons and activities for students to learn about the processes that create differences in surface temperatures, as well as how human activities have led to the creation of urban heat islands.
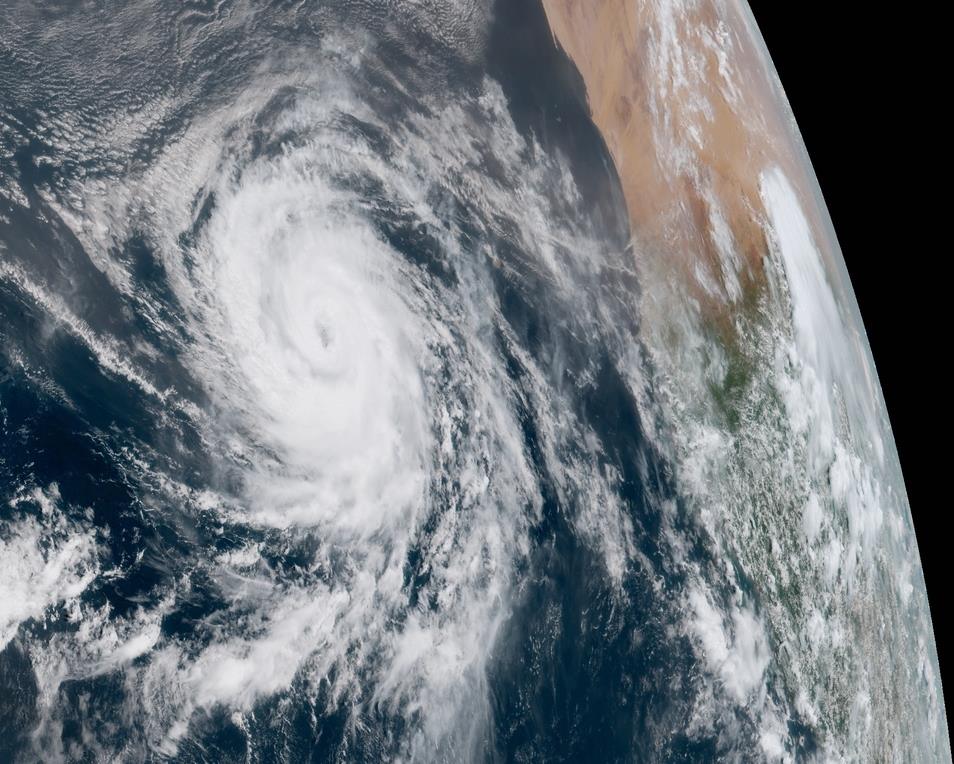
The Hurricane Dynamics Implementation Sequence provides a series of lessons and activities for students to learn how hurricanes affect the different spheres within the Earth System by using maps and other geographic representations, tools, and technologies to acquire, process, and report informat
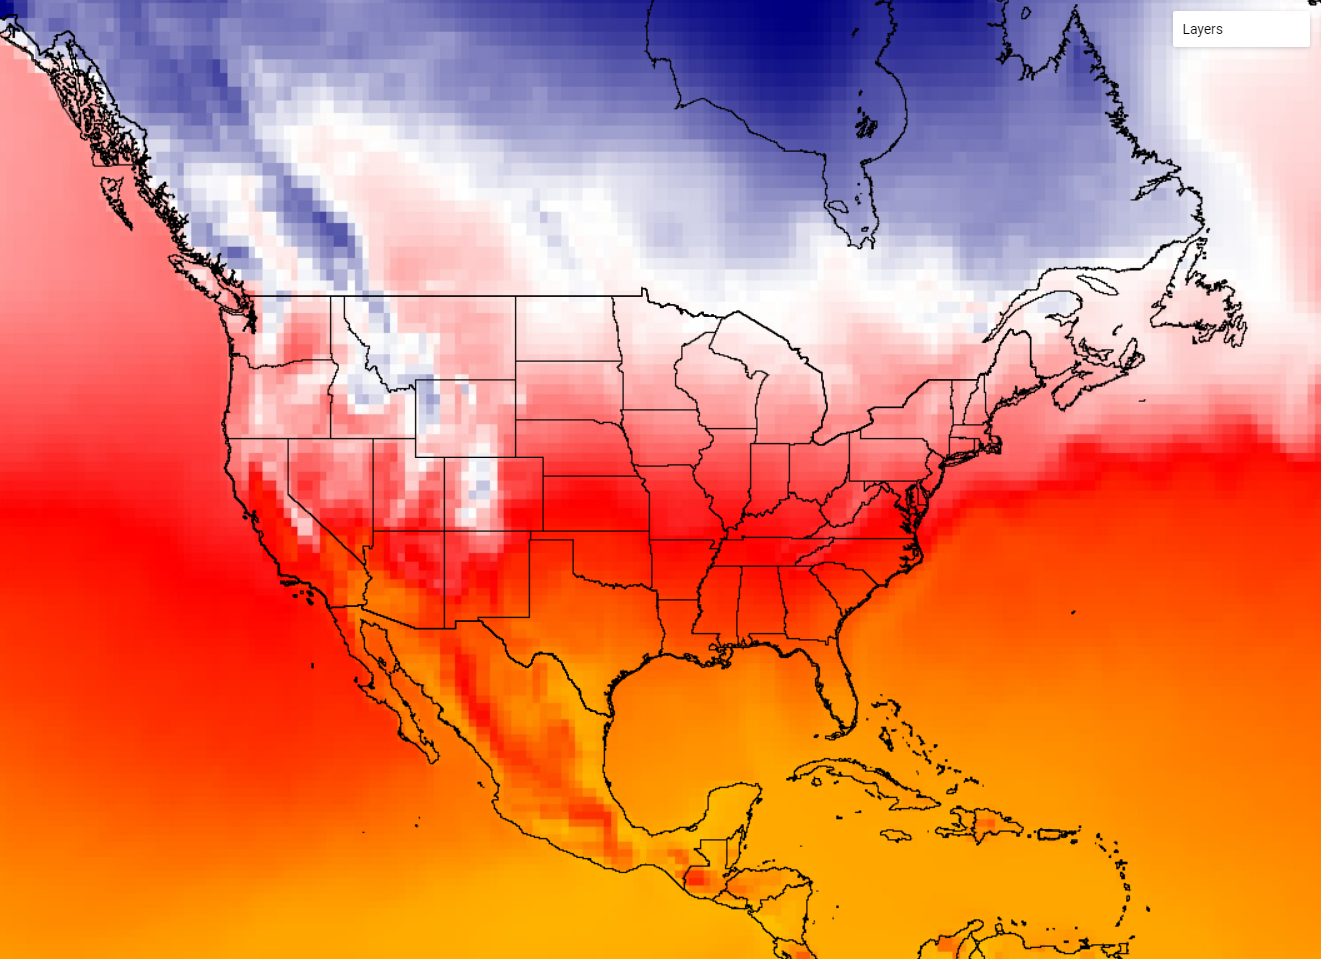
Students will explore the relationship between Nitrogen Dioxide and Precipitation in Earth's atmosphere. They will explore the data provided, make a claim, and complete a slide guided by a rubric.
The Earth System Satellite Images, along with the Data Literacy Cubes, helps the learner identify patterns in a specific image.
These NASA lessons support Next Generation Science Standards (NGSS) and three dimensional learning of the Earth System. These include activities where students interact with NASA maps, graphs, and datasets from the atmosphere, biosphere, cryosphere, geosphere, hydrosphere and the earth system.
