Grade Level: 6-8,
9-12
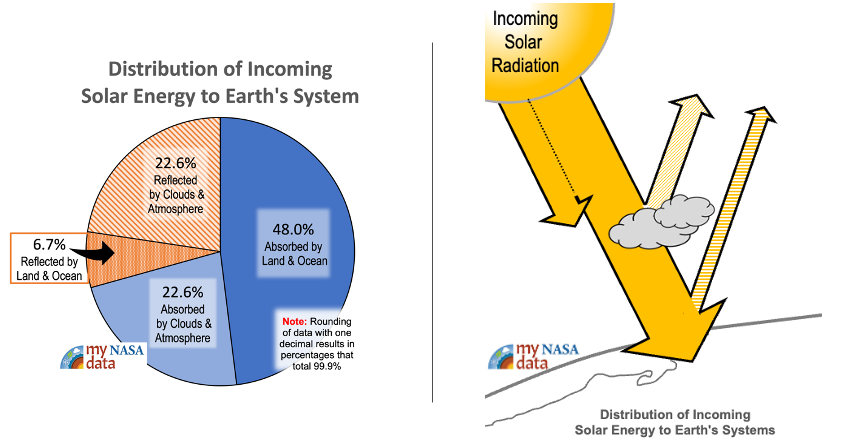
A kinesthetic activity that challenges students to participate in a model that describes the fate of solar energy as it enters the Earth system. A good initial lesson for Earth’s energy budget, students unravel the benefits and limitations of their model.